Admin UI: SSO and enhancements
Admin UI of Centrifugo OSS supports only one admin user identified by the preconfigured password. For the corporate and enterprise environments Centrifugo PRO provides a way to integrate with popular User Identity Providers (IDP), such as Okta, KeyCloak, Google Workspace, Azure and others. Most of the modern providers which support OpenID connect (OIDC) protocol with Proof Key for Code Exchange (PKCE) and OpenID Connect Discovery are supported. This provides a way to integrate Centrifugo PRO into your existing Single Sign-On (SSO) infrastructure.
Also, Centrifugo PRO extends admin UI in other ways providing more data about the system state.
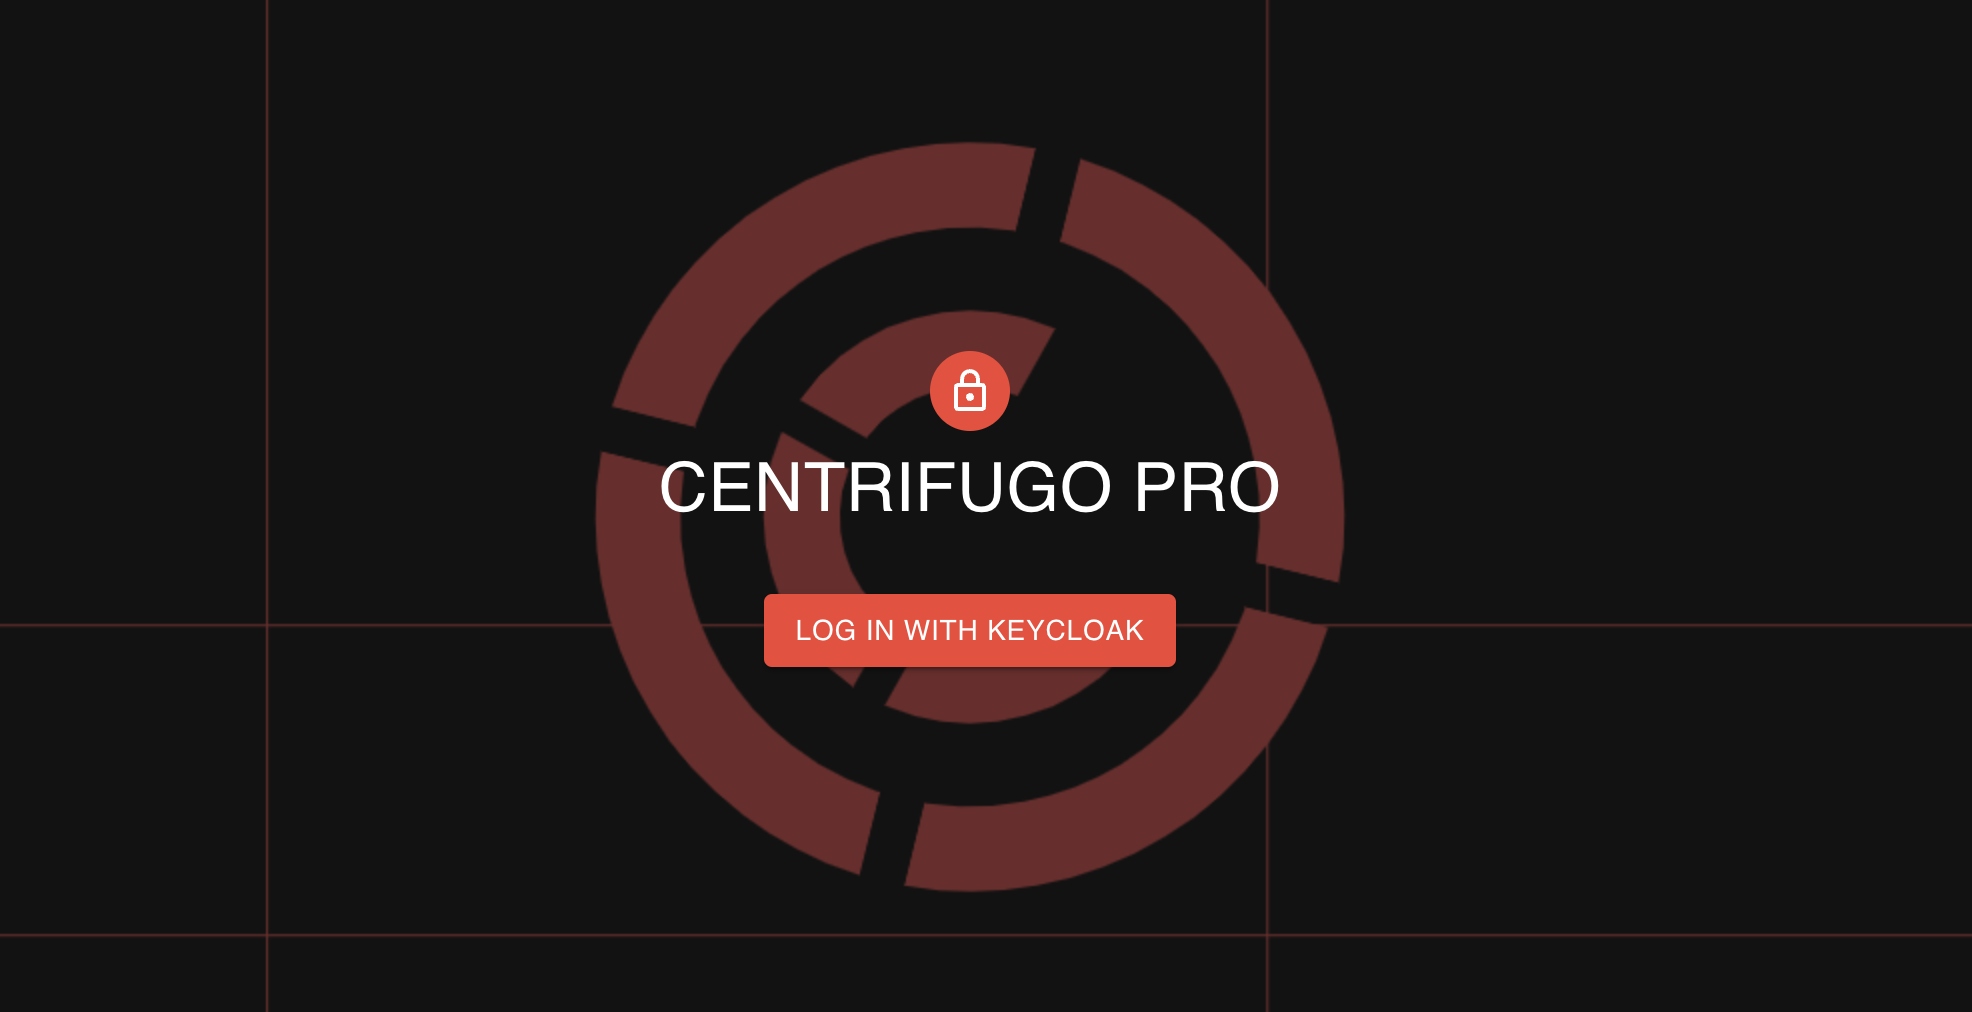
SSO for admin UI (OIDC)
As soon as OIDC integration is configured, instead of the password field, Centrifugo PRO admin web UI shows a button to log in using a configured Identity Provider. As soon as a user successfully logs in via the IDP, the user is redirected back to Centrifugo admin UI. Centrifugo checks the user's access token and permissions to access admin functionality upon every request to admin resources.
Configuration
{
  "admin": {
    ...
    "oidc": {
      "enabled": true,
      "display_name": "Keycloak",
      "issuer": "http://localhost:8080/realms/master",
      "client_id": "myclient",
      "audience": "myclient",
      "redirect_uri": "http://localhost:8000",
      "extra_scopes": [],
      "access_cel": "'centrifugo_admins' in claims.groups"
    }
  }
}
admin.oidc.enabled- boolean option which enables OIDC integration. When it's on, it's only possible to log in to Centrifugo over OIDC. By default,false. Enabling OIDC also enables validation of the required options below.admin.oidc.display_name– required string, name of IDP to be displayed on login button.admin.oidc.issuer- required string, the URL identifier of Identity Provider which will issue tokens. It's used for initializing OIDC provider and used as a base for the OIDC endpoint discovery.admin.oidc.client_id- required string, identifier for registered client in IDP for OIDC integration with Centrifugo.admin.oidc.audience- optional string, if not set Centrifugo expects access token audience (aud) to match configuredclient_idvalue (as required by the OIDC spec).admin.oidc.redirect_uri- required string, redirect URI to use.admin.oidc.extra_scopes- optional array of extra string scopes to request from IDP. Centrifugo always includesopenidscope as it's required by OpenID Connect protocol.admin.oidc.access_cel– required string, this is a CEL expression which describes the rule for checking access to Centrifugo admin resources. For now we don't provide RBAC – when this expression returns true the user gets full access to Centrifugo admin resources. If false – no access at all. For more information about what CEL is, check out the Channel CEL expressions chapter where CEL expressions are used for channel permission checks.
Let's look closer at admin.oidc.access_cel. In the example above we check this based on a user group membership:
{
  "admin": {
    ...
    "oidc": {
      ...
      "access_cel": "'centrifugo_admins' in claims.groups"
    }
  }
}
The expression may differ depending on the IDP used – you can modify it to fit your case. Inside CEL you have access to the token claims object with all claims of the access token (which is a JWT), so custom logic is possible. If you want to allow all authenticated users to access Centrifugo admin resources – then you can do the following:
This is usually not recommended, since every new user in your IDP will get access to Centrifugo admin UI. Deciding based on groups or some other token attribute is more secure and flexible.
{
  "admin": {
    ...
    "oidc": {
      ...
      "access_cel": "true"
    }
  }
}
Configuring server-side OIDC
Starting from Centrifugo PRO v6.5.2 a server-side OIDC flow is supported. In that case token exchange happens on the backend side using client_secret, and Centrifugo uses HTTP-only cookie for the established authenticated session. When using the server-side flow, https for Centrifugo admin UI is required because the cookie is set with a secure flag.
To enable server-side OIDC flow, add the client_secret option to your OIDC configuration:
{
  "admin": {
    ...
    "secret": "long-secret-here-at-least-32-characters",
    "oidc": {
      "enabled": true,
      "display_name": "OKTA",
      "issuer": "https://your-domain.okta.com",
      "client_id": "myclient",
      "client_secret": "your-client-secret-here",
      "audience": "myclient",
      "redirect_uri": "https://centrifugo.example.com/admin/oidc/callback",
      "extra_scopes": ["groups"],
      "access_cel": "'centrifugo_admins' in claims.groups"
    }
  }
}
admin.oidc.client_secret- optional string, when provided enables server-side OAuth2 flow. The client secret is registered in your Identity Provider for the Centrifugo client application.
The redirect_uri must point to /admin/oidc/callback path of Centrifugo admin UI.
When using server-side OIDC (client_secret is configured), you must also set admin.secret with at least 32 characters. This secret is used to encrypt ID tokens stored in HTTP-only cookies, providing additional security for the authentication flow.
When client_secret is configured:
- User clicks "Log in" button and is redirected to the Identity Provider
- After successful authentication, the IDP redirects back to Centrifugo with an authorization code
- Centrifugo backend exchanges the code for tokens using the client secret (this happens server-side)
- Centrifugo validates the ID token and checks permissions using the
access_celexpression - The ID token is encrypted using
admin.secretand stored in a secure HTTP-only cookie - All subsequent admin UI requests are authenticated by decrypting and validating the cookie
The choice between PKCE and server-side flow depends on your security requirements and infrastructure. For most cases, PKCE flow (without client_secret) is sufficient and easier to set up.
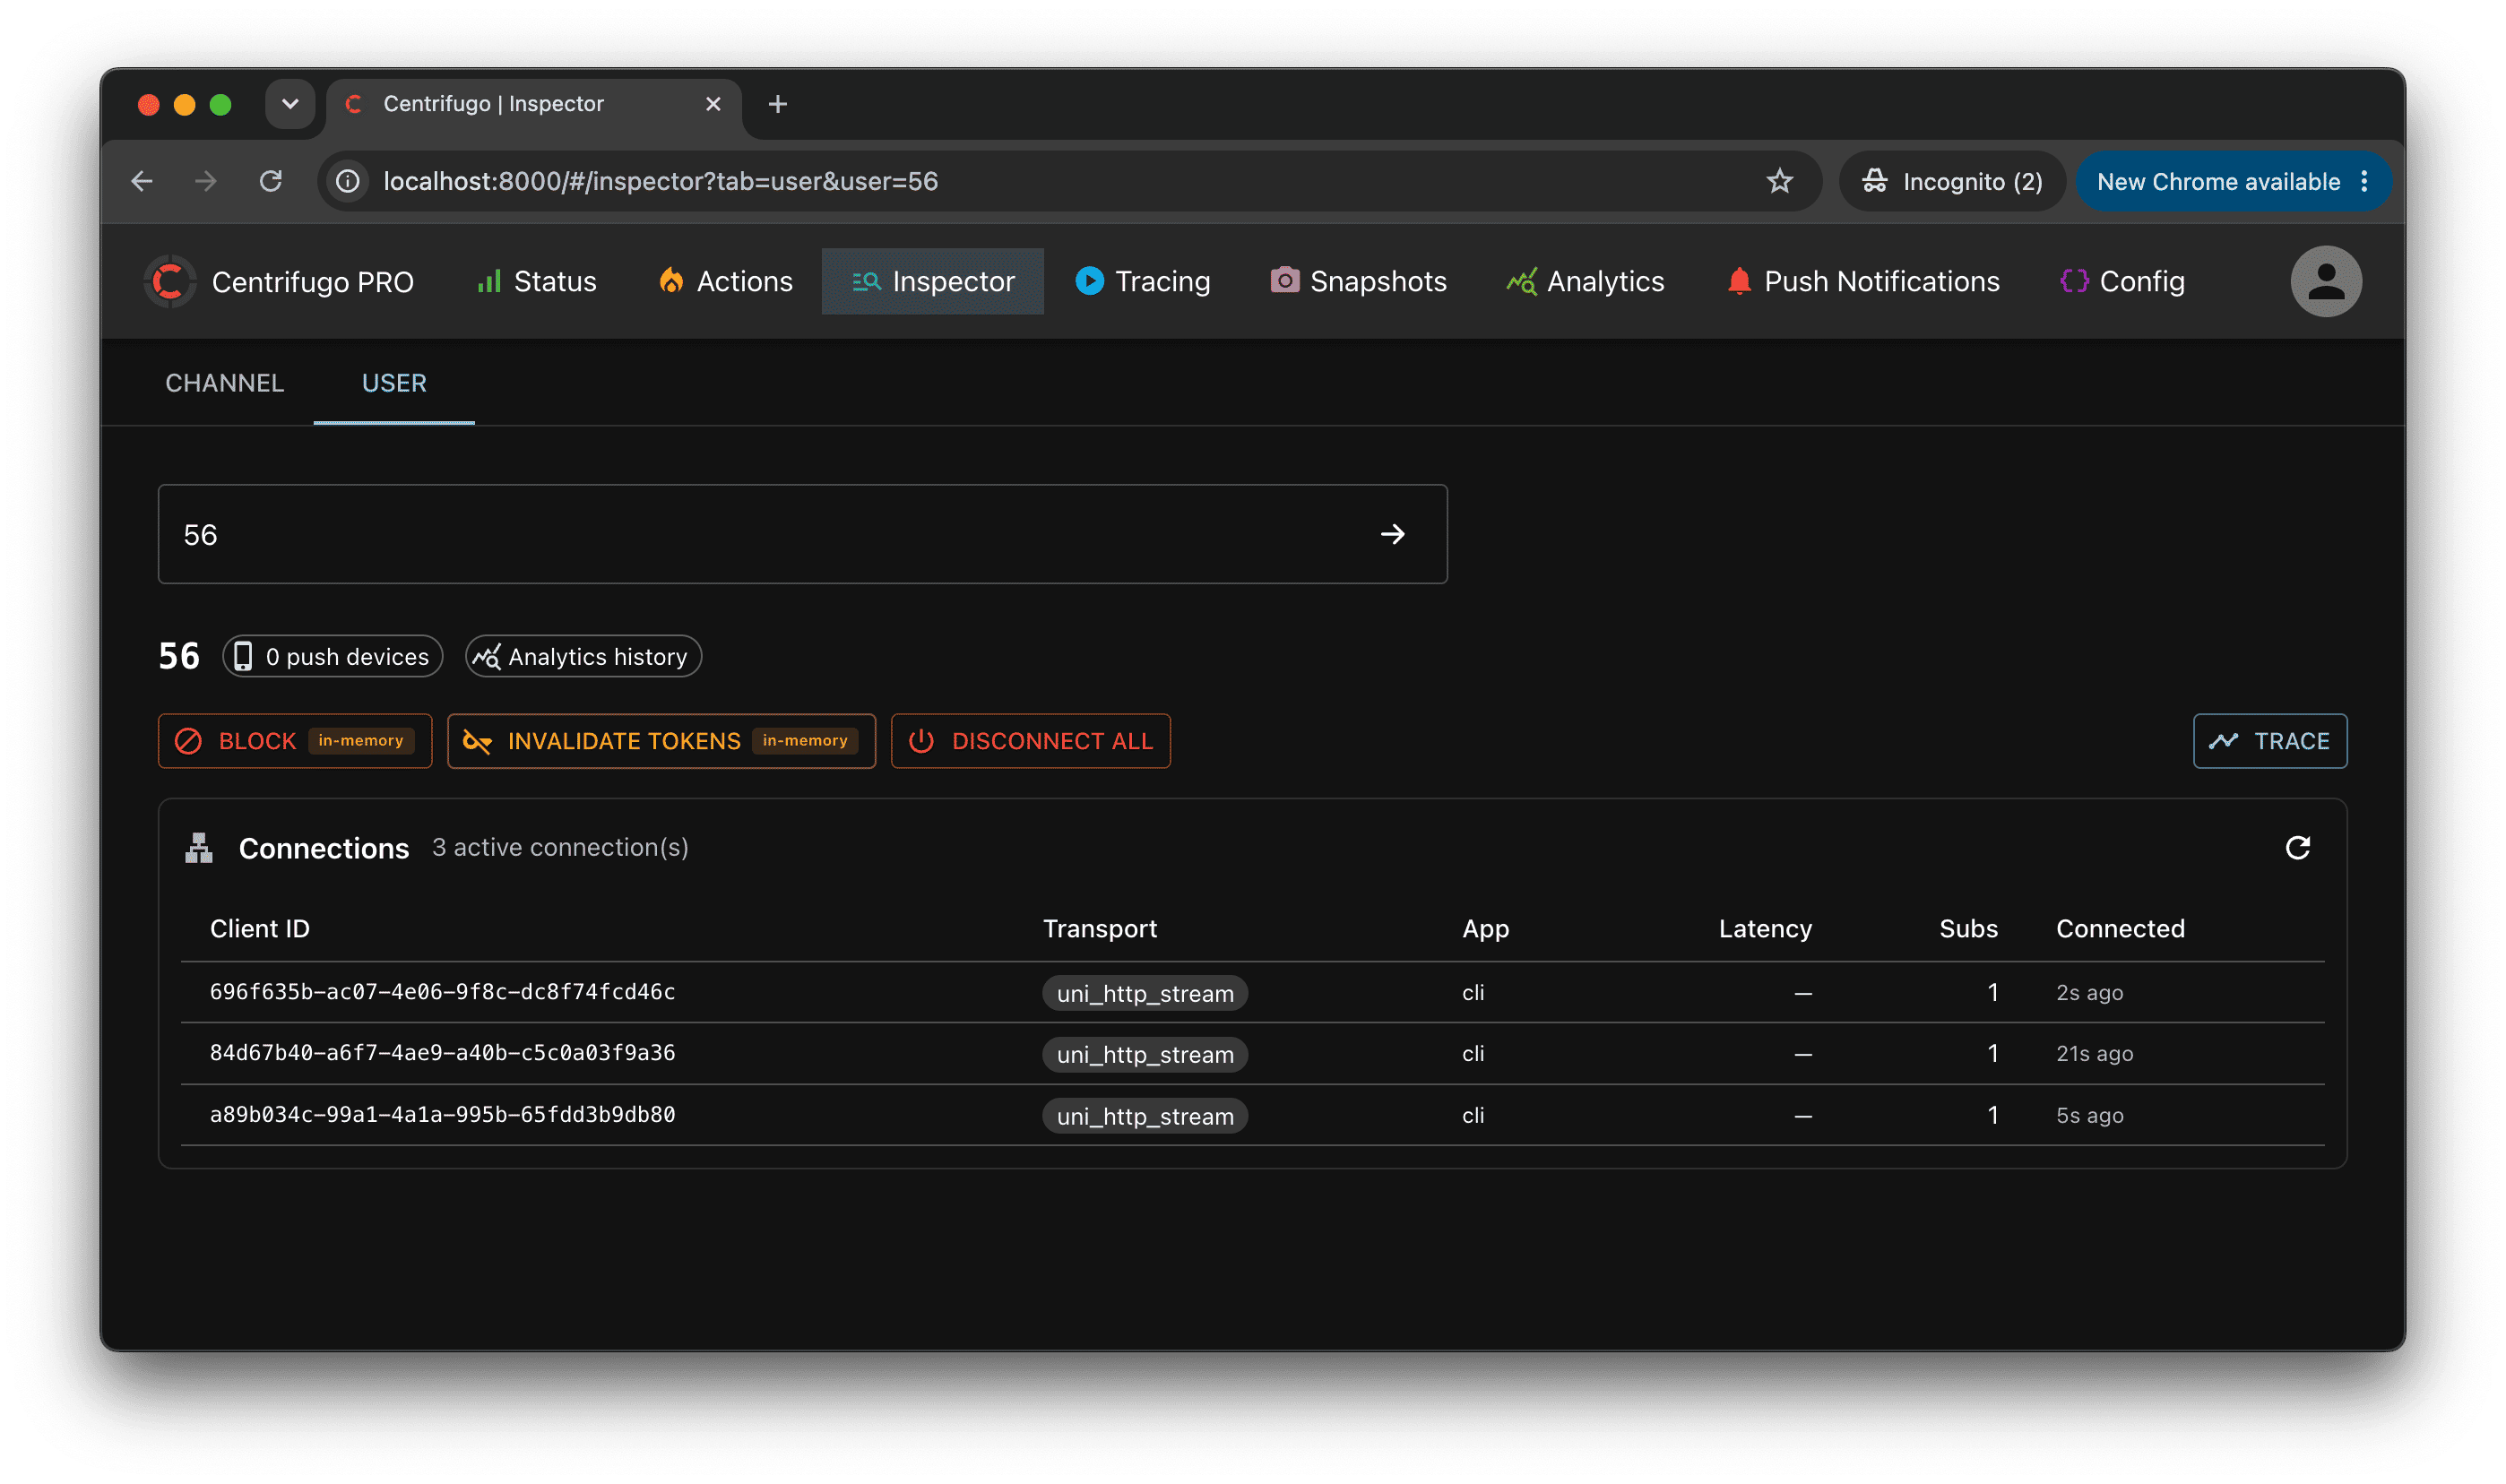
Inspector
The Inspector is a config-aware operational view for a single channel or user. Type a channel name or user ID and it shows how Centrifugo resolves it from your configuration, its live real-time state, and the actions available for it. Where Tracing shows what is flowing now and Snapshots/Analytics show the whole cluster, the Inspector answers "what is the current state of this one channel/user, and what can I do about it". It uses only the existing admin API and adapts to your live configuration, so it never shows panels or actions that don't apply.
The Channel tab resolves a channel against your configuration (namespace, channel patterns and effective options) and shows a capability header (subscription type, enabled options, configured proxies, channel_regex validation) plus compact live widgets for whatever the channel supports: presence (stats, expandable to subscribed clients), history (stream position, expandable to recent publications, with purge), and map state for map subscriptions. It links out to Tracing and Analytics for the channel.
The User tab inspects everything Centrifugo knows about a user across the cluster: block state, push devices count, active connections (with per-connection details and actions – trace, revoke token, reconnect, disconnect), and user-level actions – block/unblock (see access revocation), invalidate tokens, disconnect all. Actions carry a durability badge (in-memory / durable) so you know whether the effect survives a restart, and the user's online / last-seen state is shown when user status tracking is enabled.
The Inspector requires no dedicated configuration – it's available in the admin UI automatically and adapts to what your setup enables.
Channels and Connections Snapshots
This feature allows using the admin web UI to inspect the current connections and channels state. It allows you to:
- See current connections and channels state in the cluster
- Search connections by user ID, inspect subscribers of the channel
- See connection details: transport, client info, subscribed channels, how subscription was made, connection latency (for bidirectional transports only), connection time, etc.
- Disconnect/Reconnect a specific connection
- Integrates with Centrifugo PRO Tracing to trace particular channel or particular connection in real-time.
Centrifugo PRO saves snapshot metadata to PostgreSQL database. The connections and channels raw data is effectively inserted to ClickHouse from each node during collection, so there is no expensive inter-node communication. Snapshot raw data in ClickHouse expires in 14 days by default, configurable via clickhouse_analytics.snapshots.ttl (e.g. "14 DAY").
This feature is in beta state now. Use with caution in production. Snapshot collection may add memory and CPU overhead to Centrifugo nodes.
Configuration
To enable Snapshots feature you need to turn on admin web UI, enable snapshots inside clickhouse_analytics section and also enable database section with PostgreSQL.
{
  "admin": {
    "enabled": true,
    "password": "secure-password-here",
    "secret": "long-secret-here"
  },
  "clickhouse_analytics": {
    "enabled": true,
    "clickhouse_dsn": [
      "tcp://default:default@127.0.0.1:9000"
    ],
    "clickhouse_database": "centrifugo",
    "clickhouse_cluster": "centrifugo_cluster",
    "tls": {
      "enabled": false
    },
    "snapshots": {
      "enabled": true
    }
  },
  "database": {
    "enabled": true,
    "postgresql": {
      "dsn": "postgres://test:test@localhost:5432/test?sslmode=disable"
    }
  }
}
Centrifugo PRO supports snapshot export only over ClickHouse native TCP protocol these days.
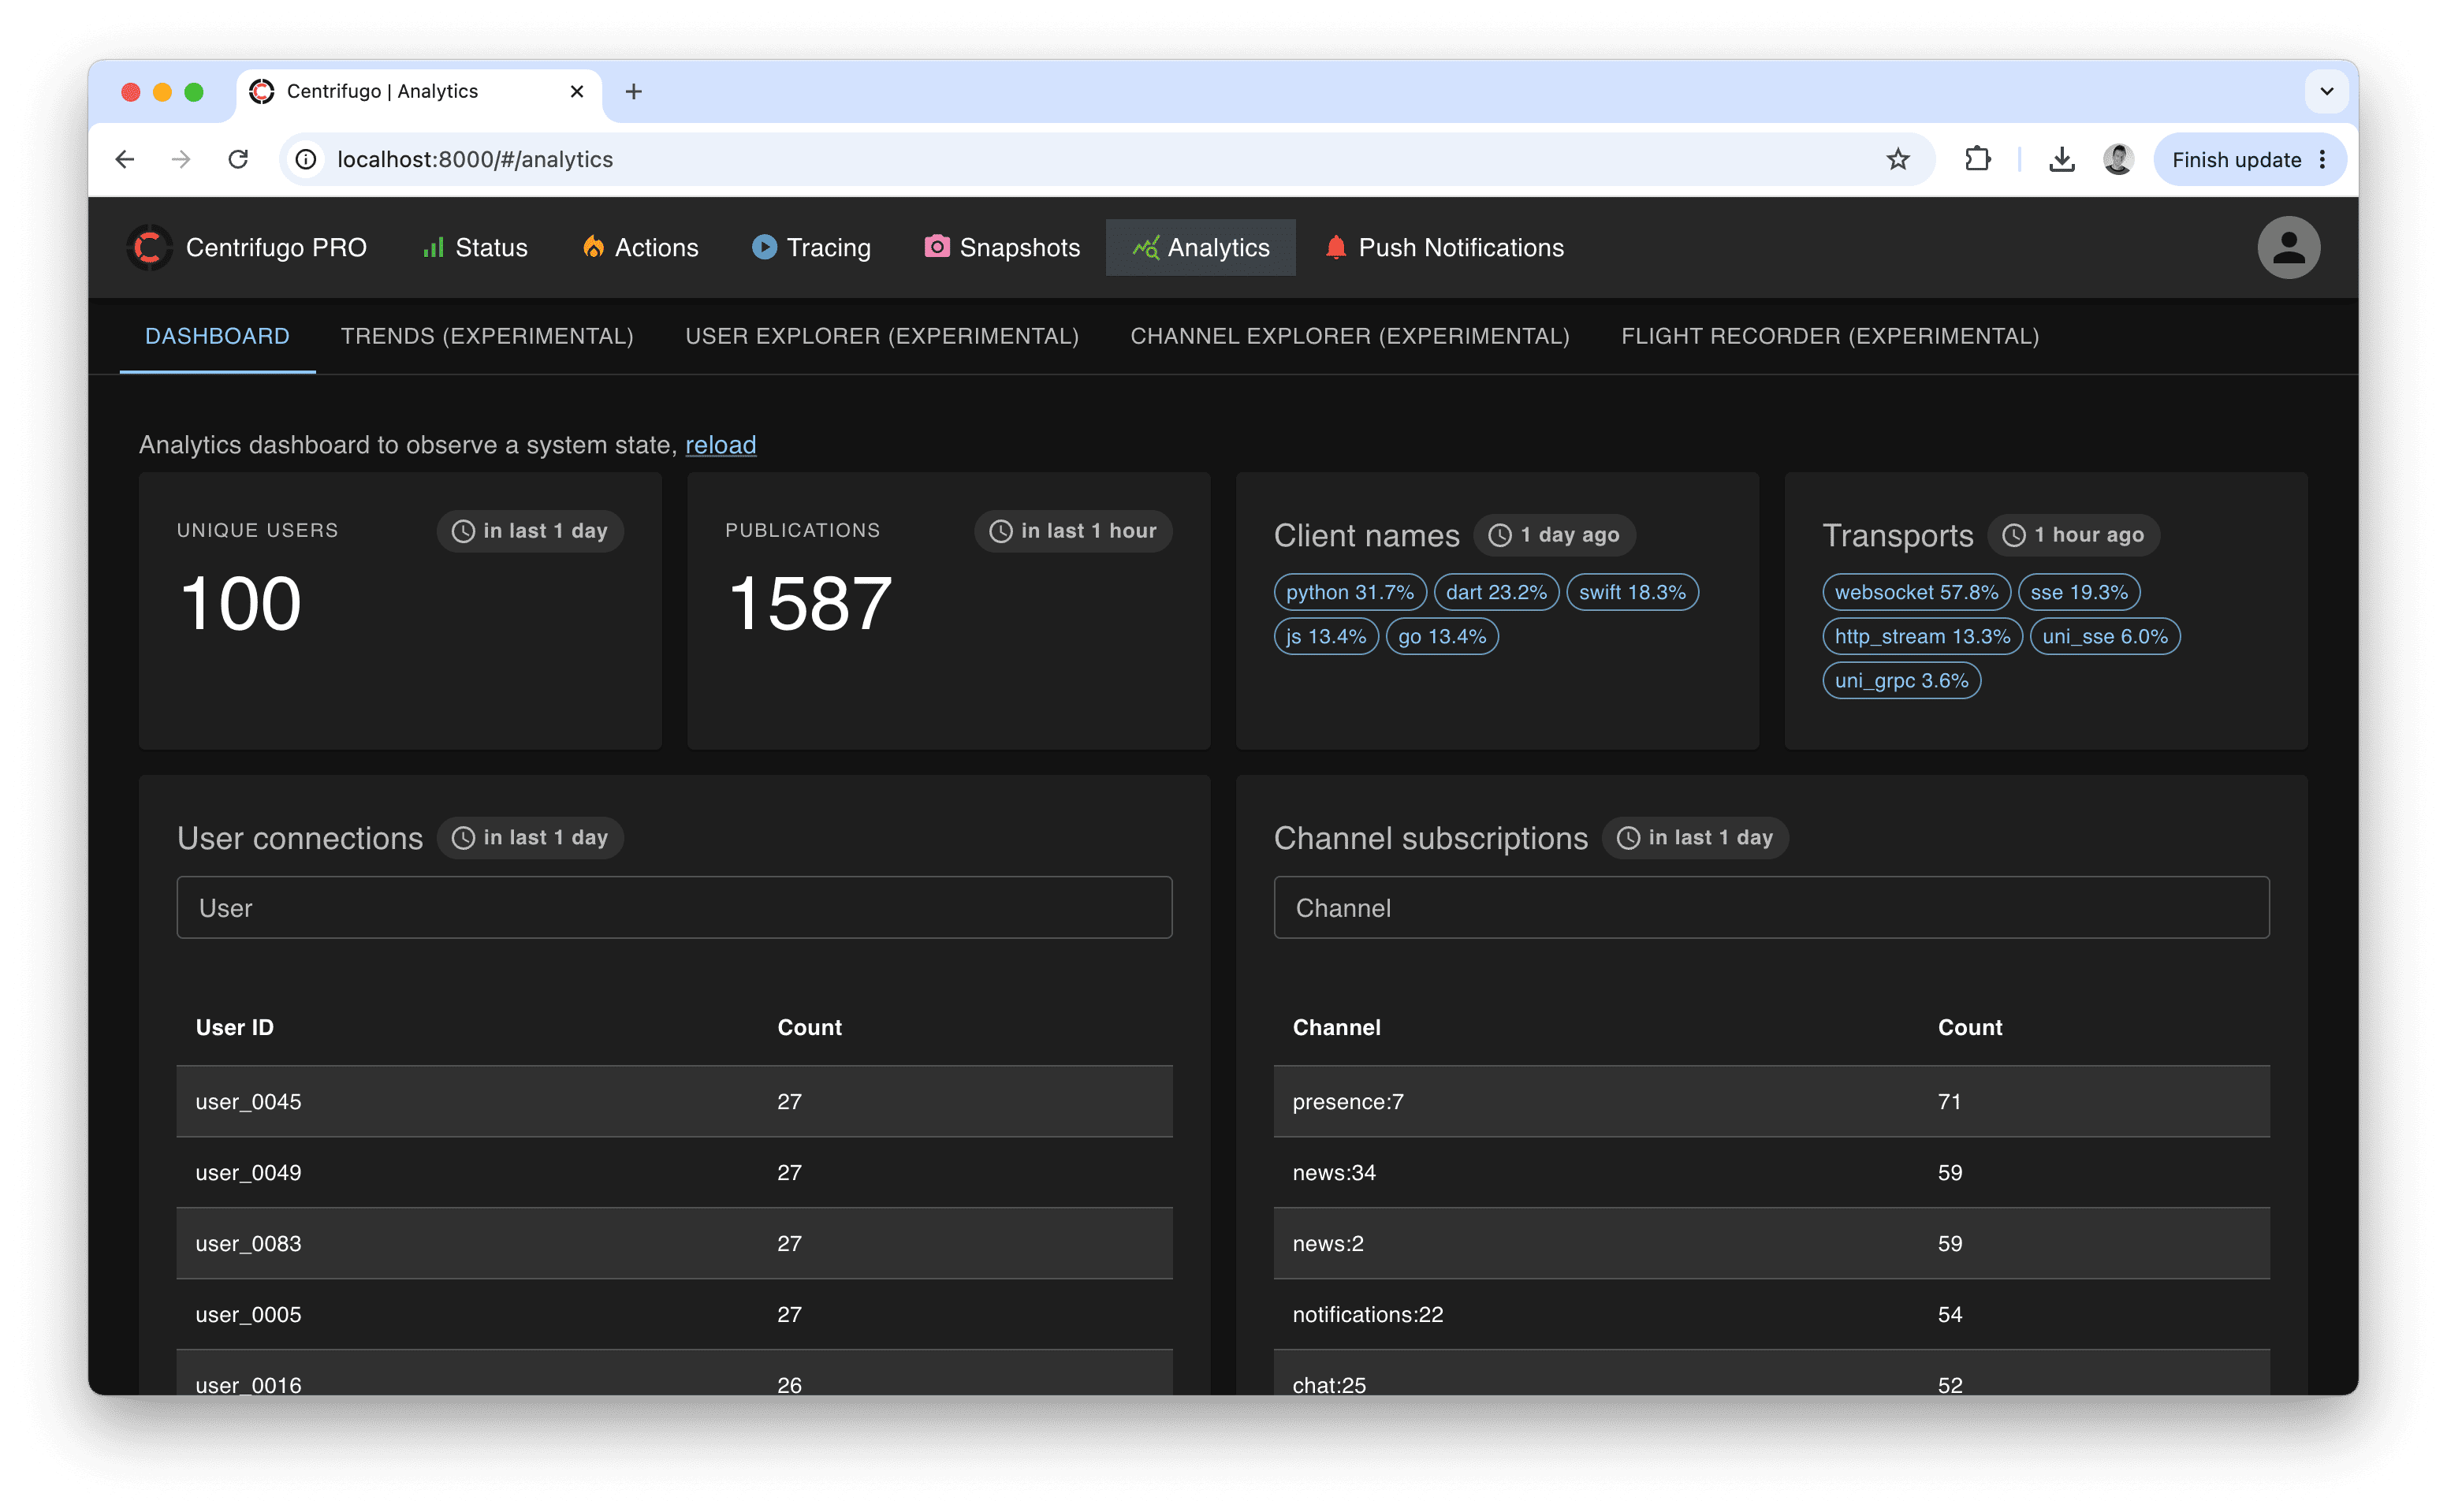
Analytics dashboards
When the ClickHouse analytics integration is enabled, the admin UI gains an Analytics page with several views built on top of the exported data: Trends, a User explorer, a Channel explorer, and an experimental Flight recorder. They turn the raw ClickHouse tables into ready-to-use dashboards, so most day-to-day observability questions can be answered without writing SQL.
These views read from ClickHouse and need no configuration beyond enabling the relevant exports in clickhouse_analytics:
- The operations export powers most Trends, the User/Channel explorers, and the Flight recorder.
- The connections export powers connection/active-user trends, the connection-latency trend, and connection profiles in the recorder.
- The subscriptions export powers subscription/channel trends.
- The publications and notifications exports power the messaging and push trends.
- Namespace breakdowns (and the
namespacefilter) work out of the box — the channel namespace is always resolved at export time.
Every view only sees data ClickHouse still retains. The default per-export ttl is 7 DAY, so longer ranges show gaps before that — see Retention for trend ranges to keep more history.
Trends
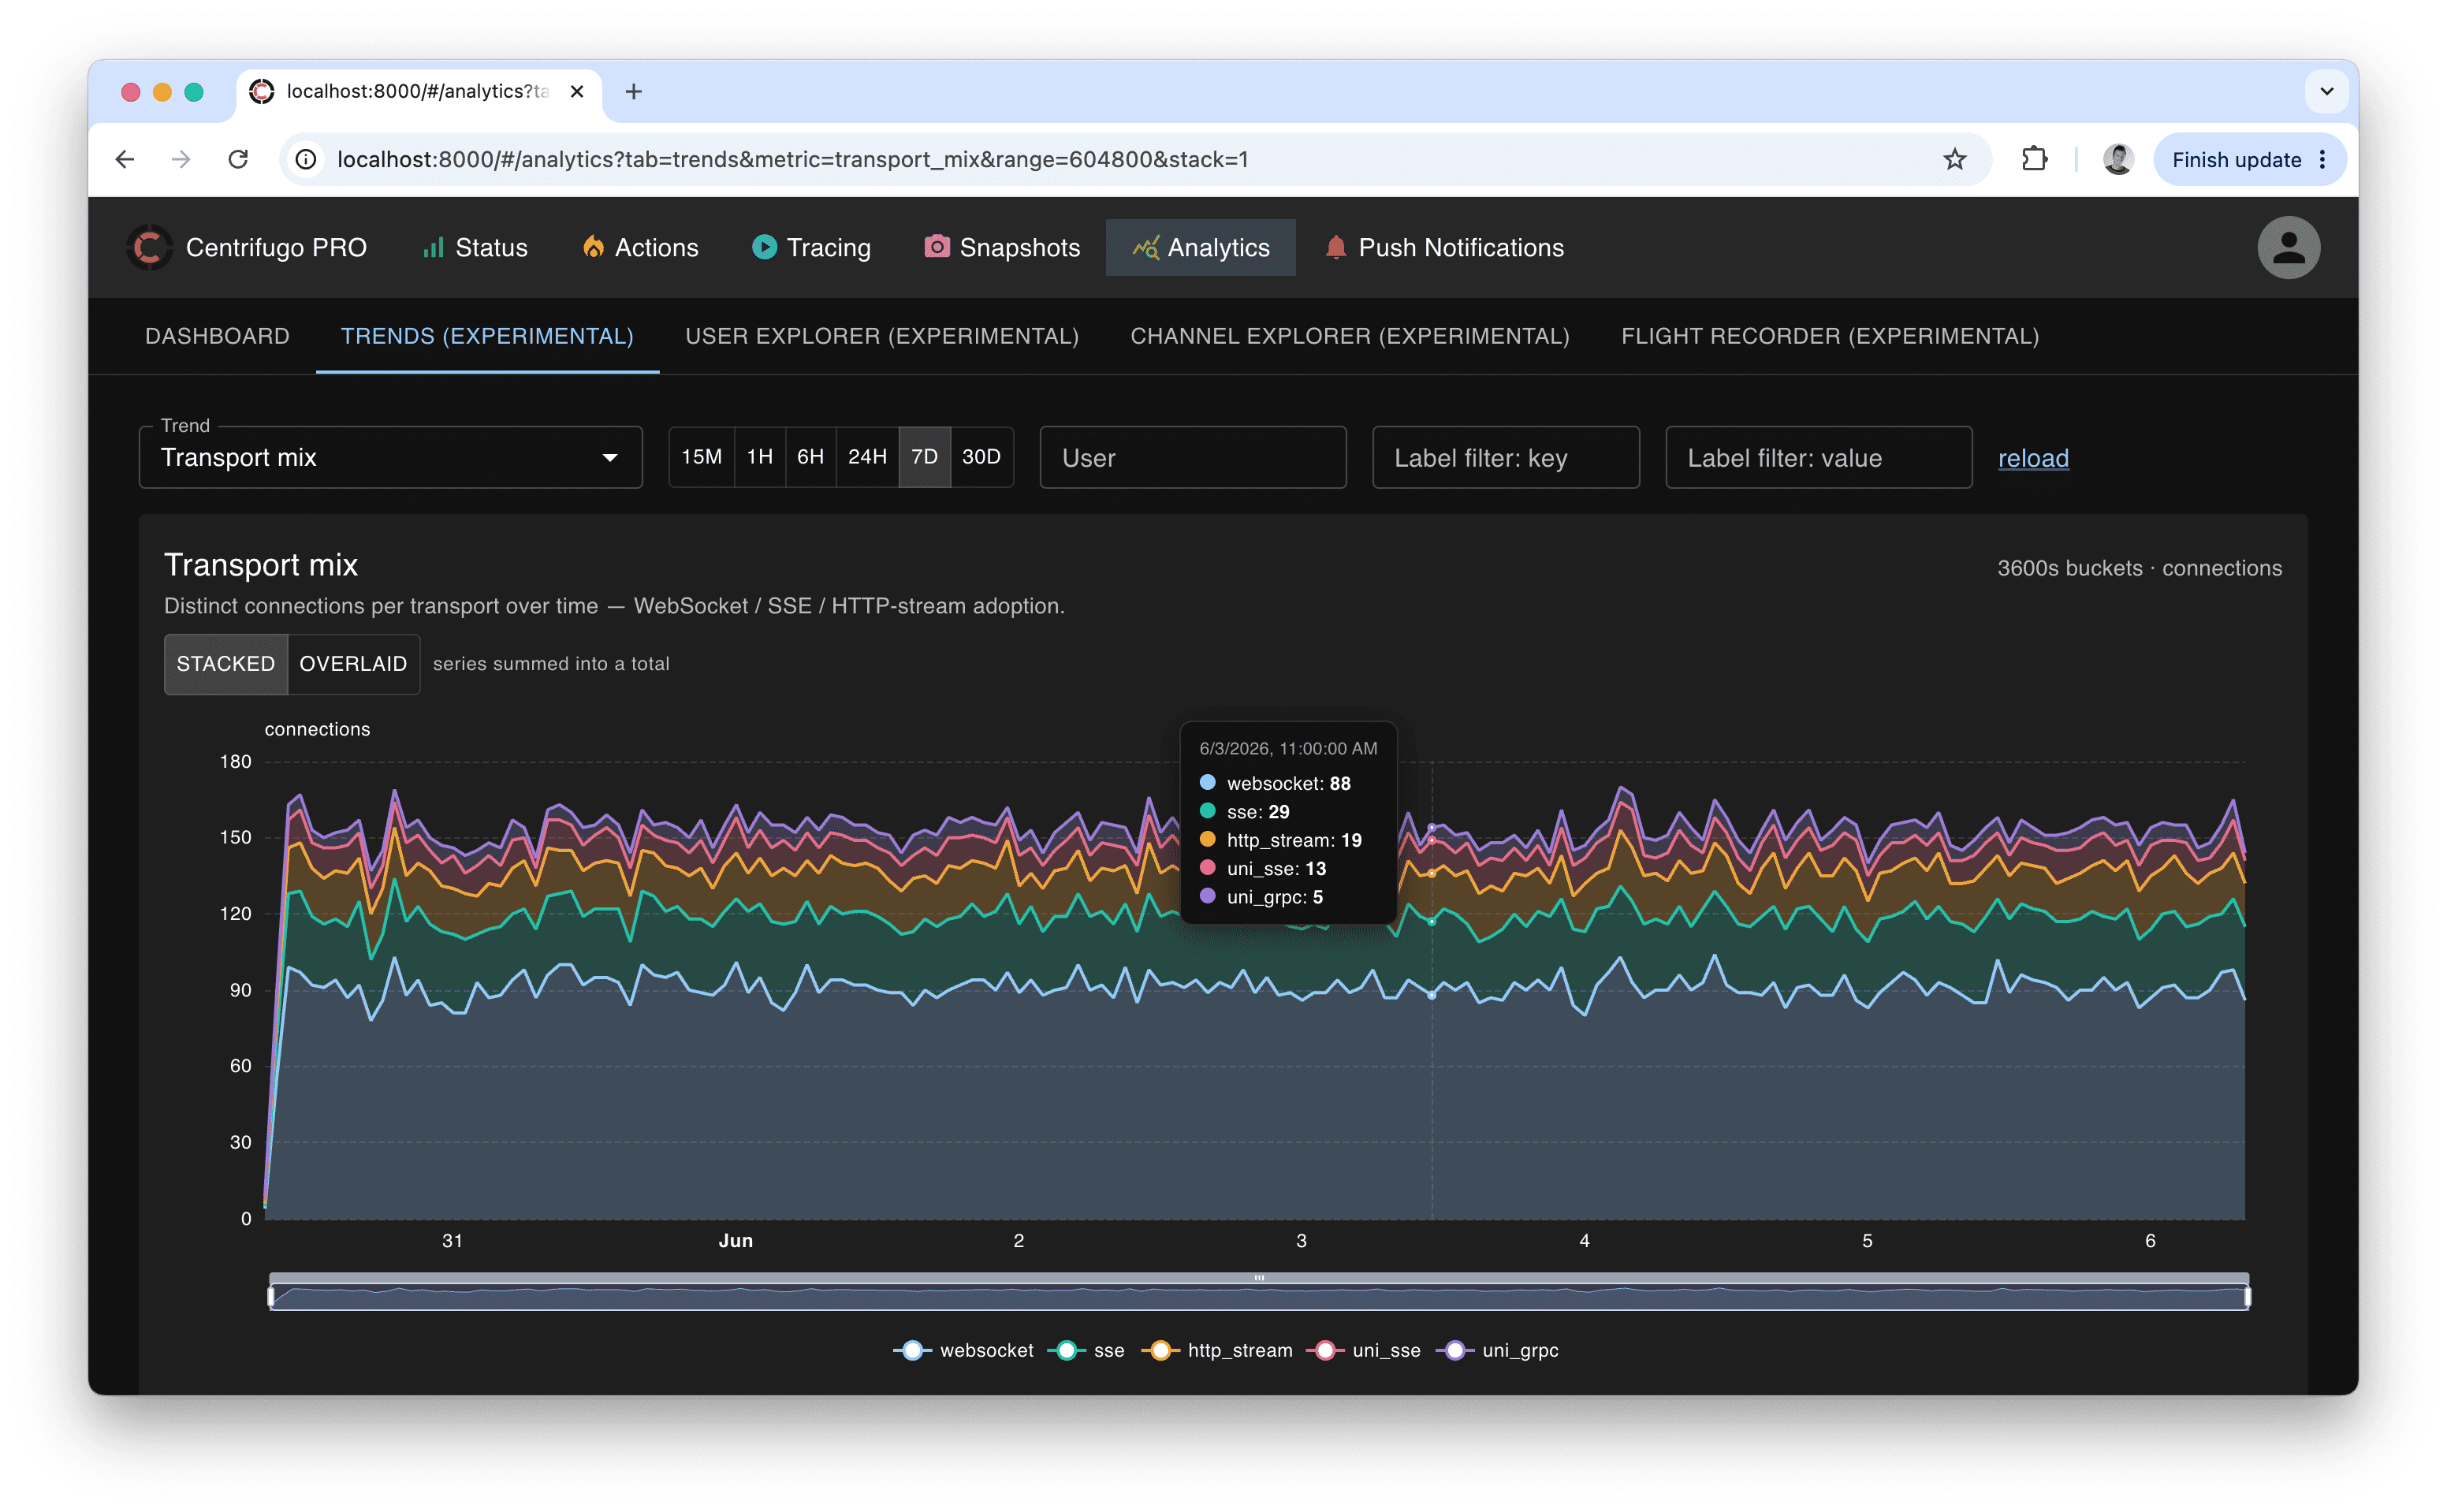
The Trends tab shows a single metric at a time as a time-series chart. You pick a metric from a catalog and a time range — presets from 15 minutes up to 30 days, or a custom range — and the engine buckets the data automatically at a granularity that suits the range (so all metrics share one aligned time axis). Charts render as line, stacked area, or bar depending on the metric, support hover tooltips, a zoom slider, and a "solo" legend (click a series to isolate it). Multi-series stacked trends also have a stacked / overlaid toggle — stacked shows the summed total, overlaid lays the series over each other for direct comparison.
Metrics that have meaningful dimensions expose filters above the chart — by user, namespace, channel, op, error code, or a client label — so you can narrow a trend to a tenant, region, namespace, or single user. Empty buckets are rendered honestly: event-rate trends show a real zero, while periodic gauges (active connections, active users) show a gap when there is no sample.
The catalog is grouped into categories:
- Operations — operations rate (total), by type, by namespace, RPC calls by method.
- Errors & health — errors by code, errors by operation, disconnect rate by code. Error trends are always broken down by code and/or operation, since some errors are expected and the code is what makes them actionable.
- Latency — operation latency p50/p95/p99, latency p95 by operation and by namespace, and connection latency p95 (client ping/pong round-trip time — the network latency of live connections, independent of operation processing time).
- Connections — active connections, connect vs disconnect rate, transport mix, SDK version adoption, connections by node (cluster load balance), connections by label.
- Users — active users, active users by label, connections per user.
- Subscriptions — active subscriptions, active channels, subscriptions by namespace, subscriptions per client, subscribe vs unsubscribe rate.
- Messaging — publications by source and by namespace, publication throughput (bytes) overall and by namespace, and delivered messages (fan-out) — publications multiplied by the number of concurrent subscribers, i.e. how many messages were actually delivered to clients.
- Push notifications — push volume by platform, the delivery funnel (sent → delivered → interacted), and push errors by code.
Leaderboards
Some trends are leaderboards — top-10 ranked tables rather than line charts: Top users by activity, Top users by publications, Top channels by subscribers, and Top channels by activity. Each row shows a total over the window, the busiest single bucket, and a sparkline of the pattern over time. An order by toggle switches the ranking between the window total and the busiest bucket. Clicking a row opens the corresponding User or Channel explorer for that entity.
User explorer
Enter a user ID and a time range to get a focused view of one user: a header strip of headline stats (connections, operations, errors, connection latency p95, …), a grid of per-user trend panels, and a key events table listing that user's recent errors and disconnects with decoded reason codes. Channels link out to the Channel explorer.
Channel explorer
Enter a channel and a time range to inspect one channel: its resolved namespace and headline stats, trend panels, top publishers and top subscribers lists, a delivered messages summary (total / per-second / per-minute and peaks), and a table of channel errors. Users link out to the User explorer.
Flight recorder
The Flight recorder is experimental and its UI may change between releases.
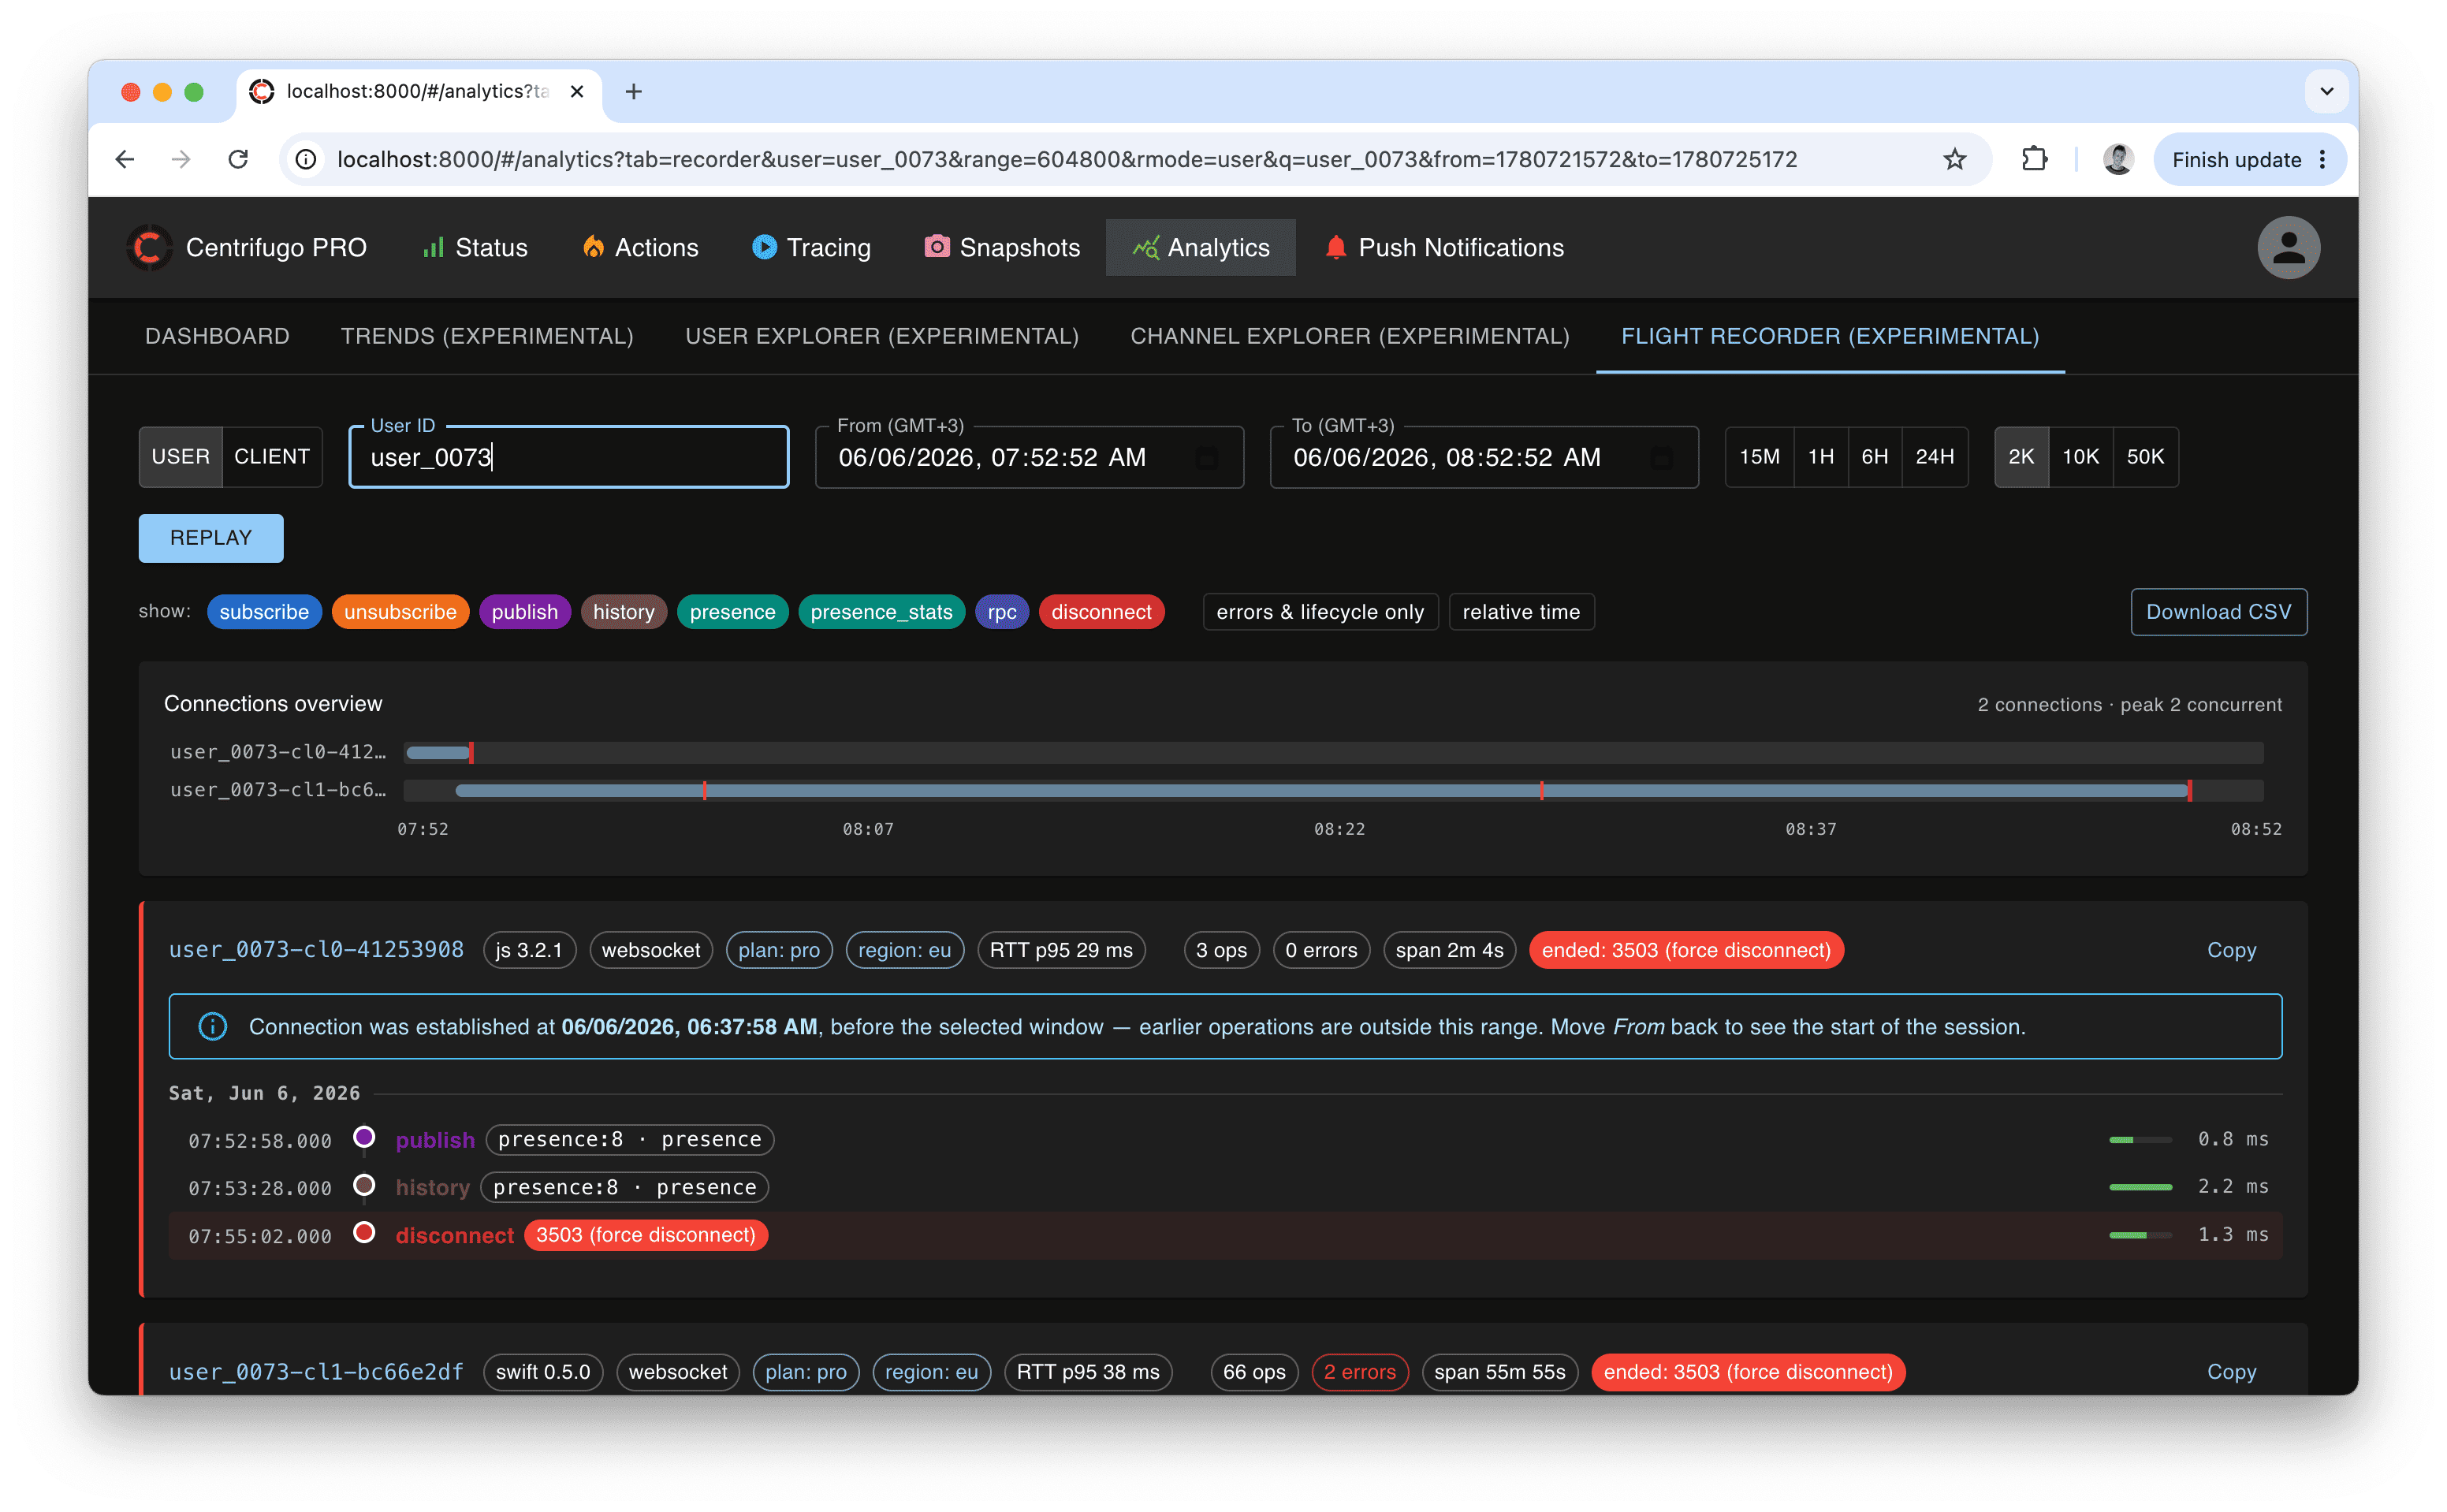
The Flight recorder reconstructs a chronological operation timeline for a single connection (by client ID) or for all connections of a user (by user ID) within an exact time range. It is the tool for answering "what exactly happened on this connection, in order?" — every connect, subscribe, publish, RPC, error, and disconnect (with decoded reason), each with its duration.
Features:
- Connection profiles — for each session it shows what the connection was: SDK name/version, transport, client labels, and ping RTT p95. When a connection was established before the selected window, it flags that the timeline is only a tail (with the actual connect time) so you can widen the range to see the start.
- Noise filters — hide routine operation types, or show only errors and lifecycle events.
- Concurrency minimap — one lane per connection on a shared time axis; overlapping bars reveal concurrency, red ticks mark errors, and a cap marks abnormal disconnects. Click a lane to jump to that session.
- Cross-linking — a channel opens the Channel explorer; a client ID drills the recorder down to that single connection.
- Export — copy a session as text, or download the full window as CSV (beyond the rendered cap).
All timestamps on this page are shown in your browser's local time zone (labelled on the From/To pickers); CSV export uses UTC (ISO-8601).
Configuration viewer
The admin UI includes a Config page that shows the effective configuration of the node serving the request — handy to confirm what a node is actually running with. It's presented as a searchable tree with inline docs for each field, and an Only non-defaults toggle to quickly see what this node overrides.
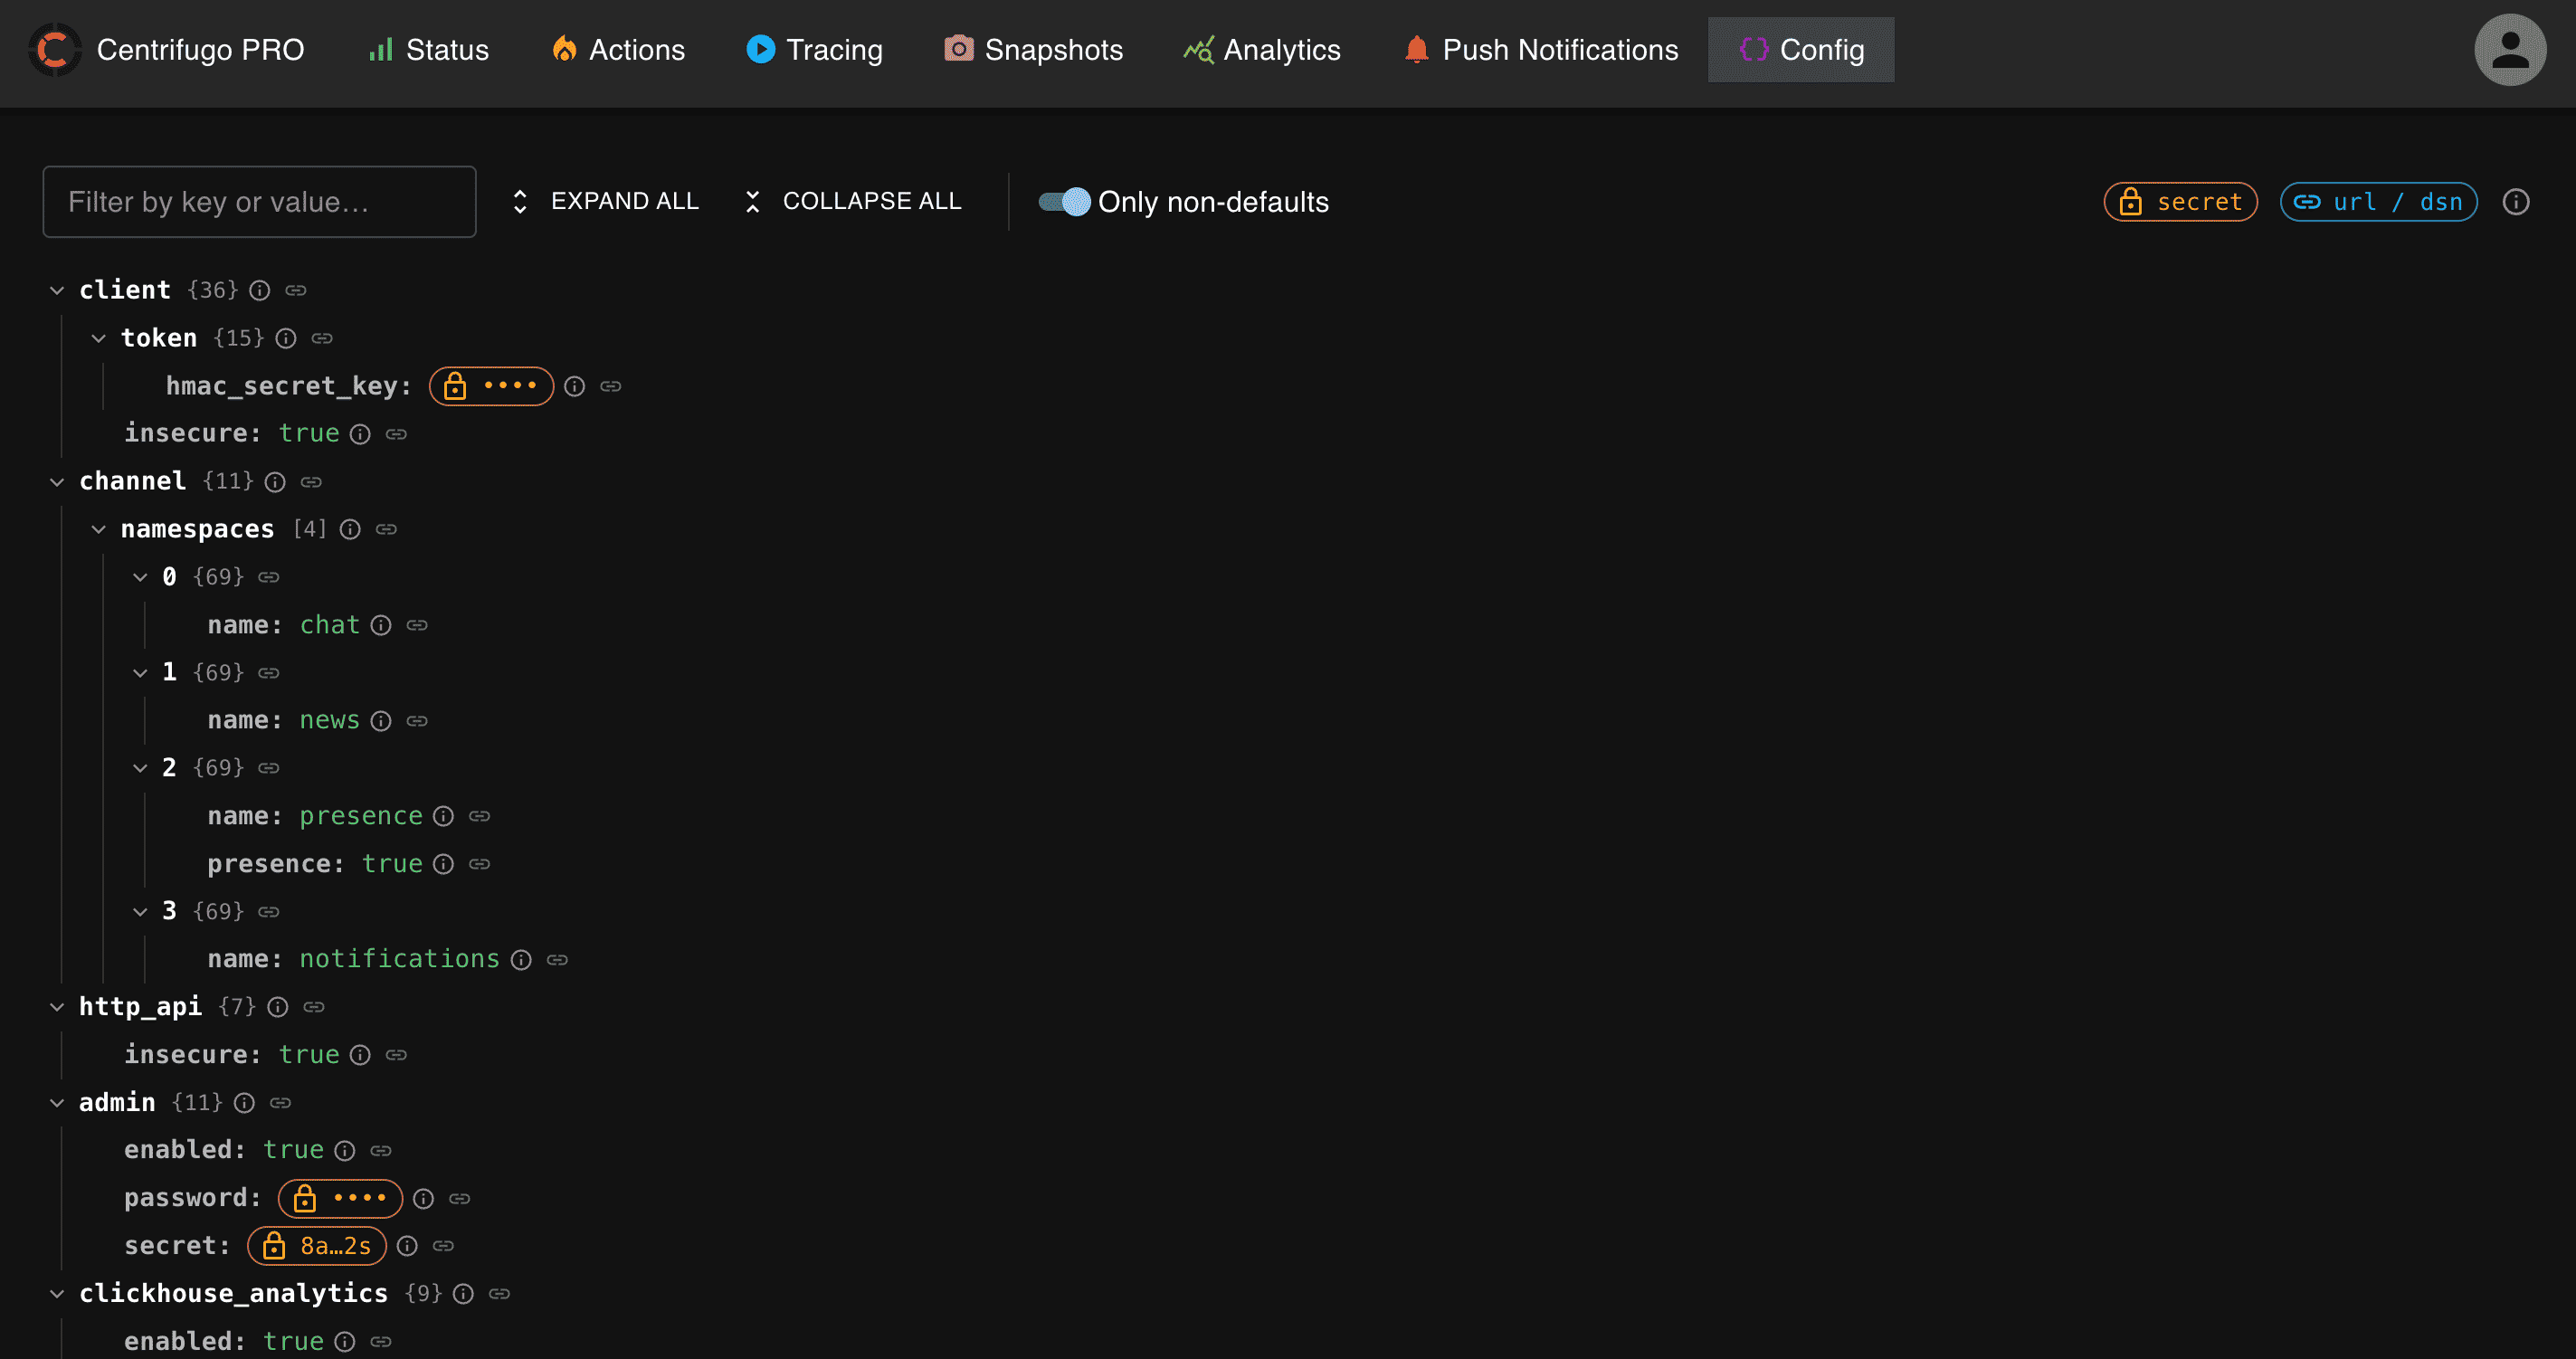
The view is read-only and safe to expose to admins: secret values and credentials in URLs/DSNs are masked on the server and never sent to the browser.
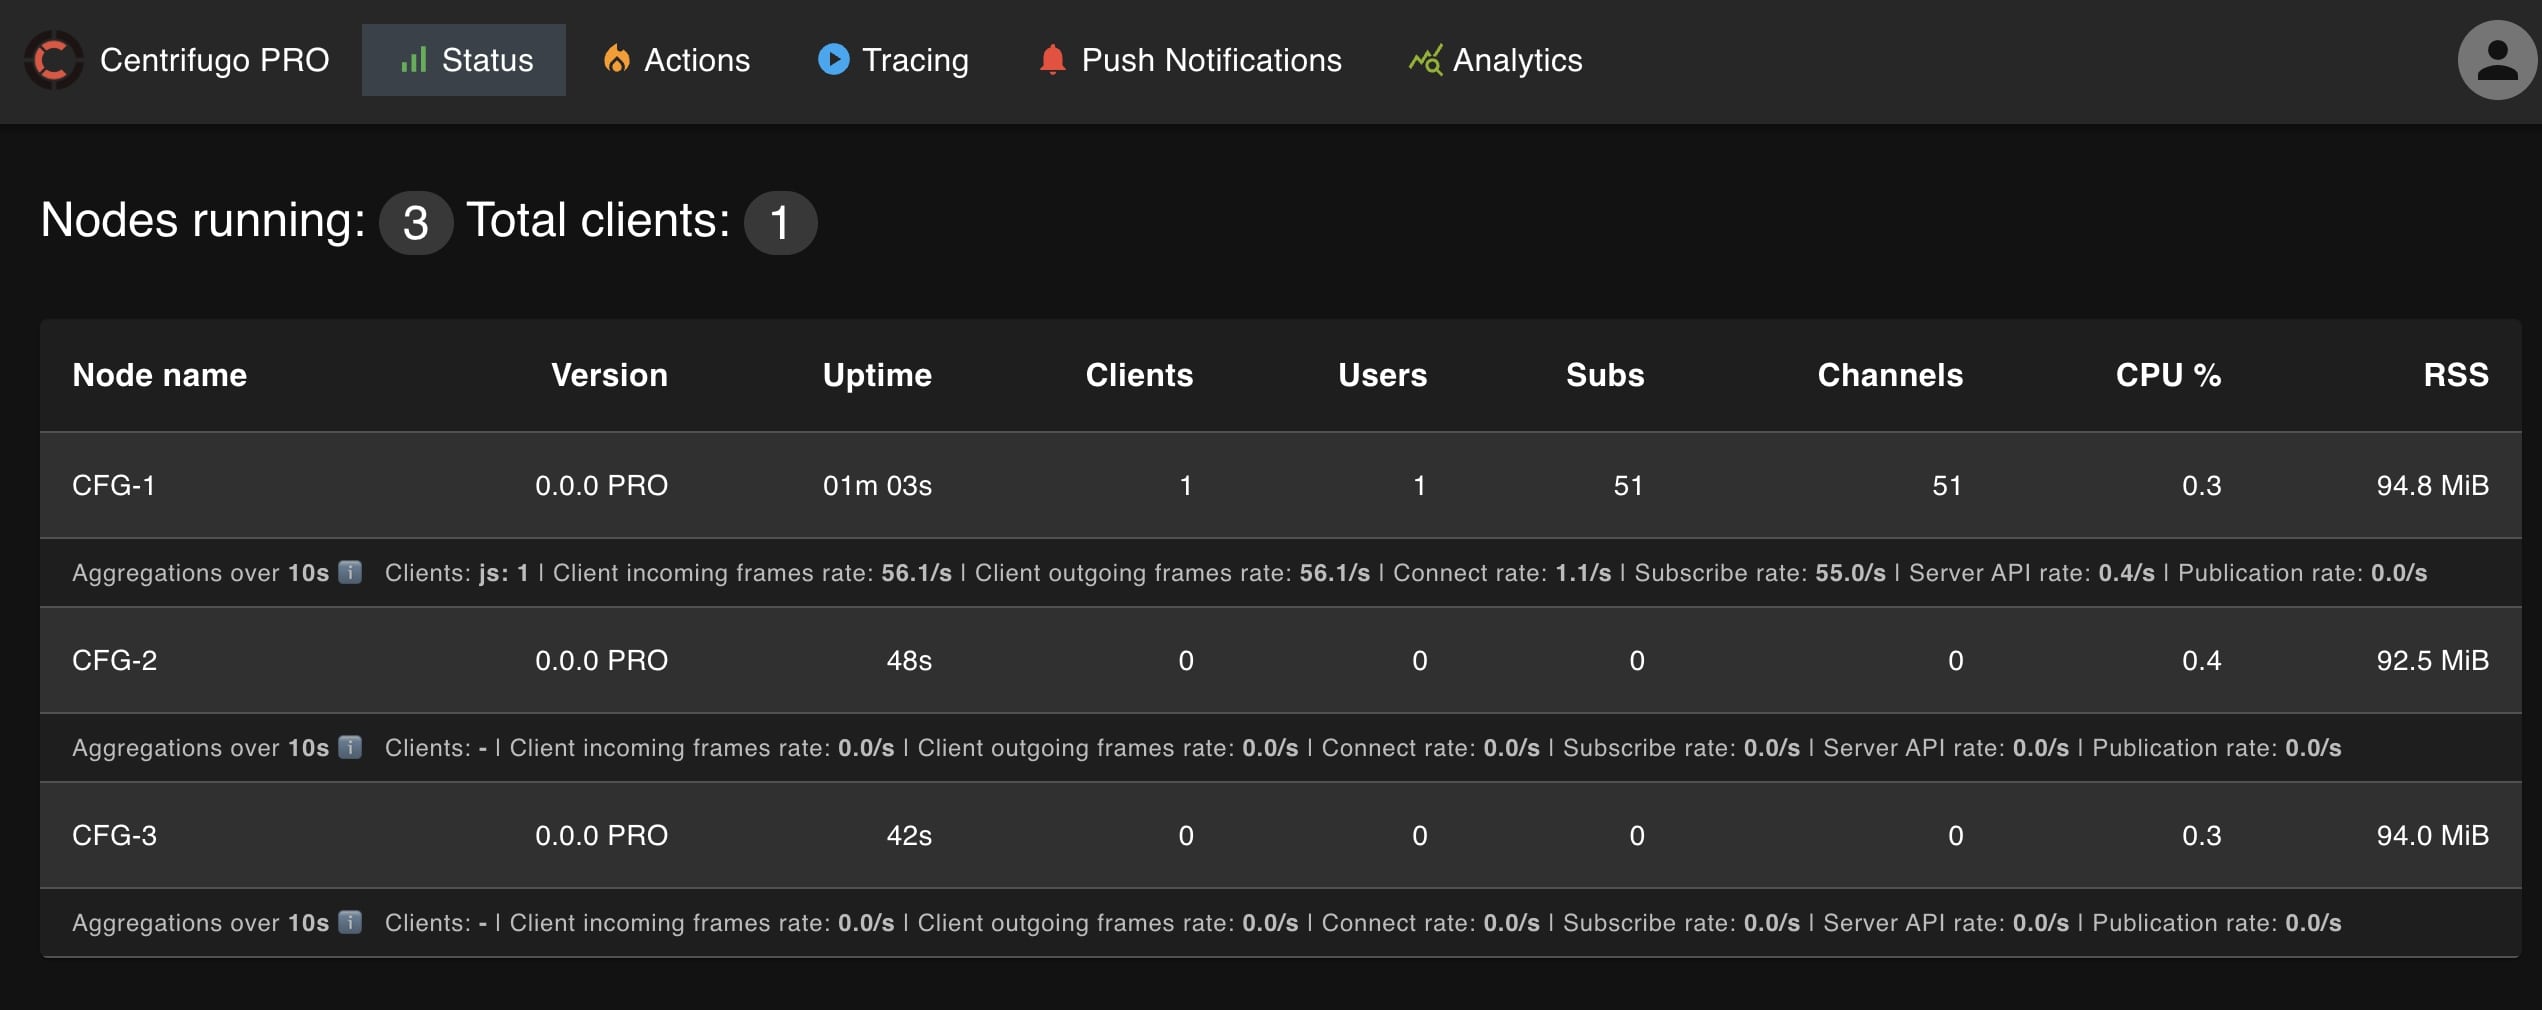
More data in admin UI
- an ability to show CPU and RSS memory usage of each node, updated in near real-time
- show aggregations over
node.info_metrics_aggregate_intervalfor each node: - Distribution by client name
- Client incoming frames rate
- Client outgoing frames rate
- Client connect rate
- Client subscribe rate
- Server API calls rate
- Publication rate
Here is how this looks like: