Observability enhancements
Centrifugo PRO provides enhanced observability, as when the business grows it's crucial to have deep insight into the system.
Client name resolution in metrics
Centrifugo PRO has some enhancements to exposed metrics.
It's possible to understand how many clients from different environments are currently connected to your Centrifugo — i.e. from a browser, from Android, iOS devices. This is possible because our SDKs pass the name of the SDK to a server and provide a way to redefine it.
Names of clients you are using in SDKs must be registered in Centrifugo configuration. This is done to avoid cardinality issues in Prometheus.
{
  "prometheus": {
    "enabled": true,
    "additional_client_names": [
      "my-name1",
      "my-name2"
    ]
  }
}
Centrifugo PRO is already aware of some names used by our official SDKs, so out of the box you will get segmentation by those.
Channel namespace resolution for metrics
Centrifugo PRO supports channel namespace resolution for many metrics related to channel. One application could be for setups with many namespaces, to understand which namespaces consume more bandwidth, or which namespace generates more frames or errors. Or the number of inflight subscriptions with channel namespace resolution!
To enable:
{
  "prometheus": {
    "enabled": true,
    "channel_namespace_resolution": true
  }
}
Centrifugo PRO requires a separate flag to enable channel namespace resolution for metrics because it may have some overhead (in most cases negligible though).
Transport accept protocol resolution
Centrifugo PRO can expose the accept protocol used by client's transport in metric labels. This allows you to understand which protocols clients are using to establish connections - for example, distinguishing between WebSocket connections that were established via HTTP/1.1 versus HTTP/2 or HTTP/3, or tracking HTTP-streaming and SSE connections by their underlying HTTP protocol version.
To enable:
{
  "prometheus": {
    "enabled": true,
    "expose_transport_accept_protocol": true
  }
}
When enabled, the following metrics will include the accept_protocol label:
centrifugo_client_connections_accepted- counter of accepted connectionscentrifugo_client_connections_inflight- gauge of current connections
The accept_protocol label can have the following values:
h1- HTTP/1.1h2- HTTP/2h3- HTTP/3
This helps in understanding the protocol distribution across your infrastructure and can be useful for performance analysis and infrastructure planning.
Client labels as Prometheus dimensions
Centrifugo PRO can export selected client labels as additional Prometheus dimensions on per-client metrics. Combined with labels set from JWT or the connect proxy, this gives per-tier, per-region, per-app-version breakdowns of connection-level metrics without operating multiple Centrifugo deployments.
To enable, list the label keys to export under prometheus.client_labels:
{
  "prometheus": {
    "enabled": true,
    "client_labels": ["region", "tier", "app_version"]
  }
}
Exported dimension names are prefixed with app_ to guarantee they cannot collide with built-in metric labels — for example, client_labels: ["region", "tier"] becomes the Prometheus dimensions app_region and app_tier. Your application code reads the unprefixed keys via labels.region / labels.tier (e.g., in CEL expressions or proxy requests) — the prefix is applied only on the metric export path.
When a configured key is missing on a particular client, the empty string is used as the dimension value (so all metric series stay shape-consistent).
Every unique combination of exported label values creates a new Prometheus time series. Keep the value set bounded and small — region (5–20 values), tier (3–5 values), app version (dozens, not millions). Do not export user IDs, session IDs, request IDs, or any unbounded input. Combined with built-in labels like transport and op, even a few high-cardinality keys can multiply your time series count rapidly.
The same caveat applies to the analytics labels column — different storage, same cardinality concern.
When client_labels is empty (the default), no label dimensions are exported and there is zero overhead on the metric emission path.
OpenTelemetry metrics export
New in Centrifugo PRO v6.8.1
Centrifugo PRO can export its metrics to an OpenTelemetry-compatible backend (Grafana Cloud, GCP Cloud Operations, Datadog, AWS CloudWatch via OTLP, OTel Collector, etc.) without running a Prometheus sidecar. Internally Centrifugo continues to use Prometheus instrumentation, then a bridge translates the metrics registry into OTLP and pushes them via the OTel SDK.
To enable, both flags are needed — the OpenTelemetry section turns the subsystem on, and metrics: true activates the metrics pipeline (in addition to traces):
{
  "opentelemetry": {
    "enabled": true,
    "metrics": true
  }
}
Endpoint, headers, and protocol are configured via the standard OTEL_EXPORTER_OTLP_* environment variables — the same ones that drive trace export:
OTEL_EXPORTER_OTLP_ENDPOINT="https://otlp.example.com" \
OTEL_EXPORTER_OTLP_HEADERS="api-key=..." \
OTEL_EXPORTER_OTLP_PROTOCOL="http/protobuf" \
./centrifugo
OTEL_EXPORTER_OTLP_PROTOCOL accepts http/protobuf (default) or grpc.
Exported metrics carry standard OTel resource attributes: service.name is centrifugo (override with OTEL_SERVICE_NAME), attributes from OTEL_RESOURCE_ATTRIBUTES are merged in (taking precedence over Centrifugo defaults), and since Centrifugo PRO v6.8.3 service.instance.id defaults to the unique Centrifugo node ID (regenerated on each process start).
If your backend is Google Cloud, set opentelemetry.google_cloud_adc_auth to push metrics straight to telemetry.googleapis.com without a sidecar — see Export to Google Cloud (ADC) below. This is a base OpenTelemetry option available in Centrifugo OSS, where it authenticates trace export; in Centrifugo PRO the same single setting also covers the metrics pipeline.
Export to Google Cloud (ADC)
New in Centrifugo PRO v6.8.2
Google Cloud's OTLP endpoint (telemetry.googleapis.com) requires every request to carry a valid OAuth2 access token. The standard OTLP exporter does not attach one, so pushing metrics straight to Google Cloud fails as unauthenticated unless you run a sidecar collector to inject credentials — which defeats the point of moving off a Prometheus sidecar.
Set opentelemetry.google_cloud_adc_auth to true to make Centrifugo authenticate the exporter with Google Cloud Application Default Credentials (ADC). Then metrics (and traces) can be pushed directly to telemetry.googleapis.com without a sidecar:
{
  "opentelemetry": {
    "enabled": true,
    "metrics": true,
    "google_cloud_adc_auth": true,
    "resource_detectors": ["gcp"]
  }
}
OTEL_EXPORTER_OTLP_ENDPOINT="https://telemetry.googleapis.com" \
OTEL_EXPORTER_OTLP_PROTOCOL="grpc" \
OTEL_RESOURCE_ATTRIBUTES="gcp.project_id=YOUR_PROJECT_ID" \
./centrifugo
resource_detectors: ["gcp"] is optional but recommended — see Cloud resource detectors.
The option works with both exporter protocols — over grpc the ADC token is attached as a per-RPC credential, over http/protobuf via an OAuth2 HTTP client transport. In both cases the token is minted lazily on first export and then cached and refreshed automatically. google_cloud_adc_auth is a base OpenTelemetry option (shared with tracing), so a single setting covers both pipelines.
Set the target project via OTEL_RESOURCE_ATTRIBUTES="gcp.project_id=...". Do not put it in OTEL_EXPORTER_OTLP_HEADERS as x-goog-user-project — Google warns that this can produce duplicate values and fail requests.
Google Cloud derives the instance label of the time series identity from the service.instance.id resource attribute and requires points of each series to arrive in order. When several Centrifugo instances report under the same service.instance.id — or without one at all — Google Cloud rejects their interleaved points as out-of-order and metrics may collapse to zero. Since Centrifugo PRO v6.8.3 each process reports its unique node ID as service.instance.id, so autoscaled deployments get distinct time series automatically. To use your own identity, set OTEL_RESOURCE_ATTRIBUTES="service.instance.id=..." — the environment value takes precedence.
ADC must be resolvable in the runtime environment — automatic on GKE/GCE/Cloud Run via the attached service account, or locally via GOOGLE_APPLICATION_CREDENTIALS / gcloud auth application-default login.
Cloud resource detectors
New in Centrifugo PRO v6.8.3
opentelemetry.resource_detectors lists cloud platforms whose resource attributes Centrifugo detects from the platform metadata service at startup and attaches to exported metrics and traces:
{
  "opentelemetry": {
    "enabled": true,
    "metrics": true,
    "resource_detectors": ["gcp"]
  }
}
Supported values:
gcp—cloud.region/cloud.availability_zone,k8s.cluster.nameon GKE,faas.*service info on Cloud Run.aws—cloud.region/cloud.availability_zone, host info on EC2, container and task info on ECS.
For Google Cloud these attributes fill the location and cluster labels of the time series identity — without them all metrics land in location global. Detection outside the listed platform is a no-op, and detected values can be overridden via OTEL_RESOURCE_ATTRIBUTES. If Centrifugo runs on the platform but metadata lookups fail (server not ready yet, blocked by network policy), it exits with an error at startup rather than exporting telemetry under an incomplete identity.
Pair with native histograms for full fidelity
By default, Prometheus Histograms are translated to OTel fixed-bucket histograms. To get the high-fidelity ExponentialHistogram representation that most OTel-native backends prefer, enable native histograms alongside:
{
  "prometheus": {
    "enabled": true,
    "native_histograms": true
  },
  "opentelemetry": {
    "enabled": true,
    "metrics": true
  }
}
This is the recommended configuration for new OTel-only deployments. Prometheus scraping is not required when the OTLP push pipeline is the source of truth — you can leave prometheus.enabled: false if there are no Prometheus consumers (the bridge still works against the in-process registry).
Summary instruments are deprecated
All Prometheus Summary instruments in Centrifugo are deprecated as of v6.8.1 and will be removed in Centrifugo v7. Use the _histogram companions instead — they expose the same data in a form that aggregates correctly across nodes (histogram_quantile()) and translates cleanly to OpenTelemetry.
With prometheus.native_histograms: true recommended above, Centrifugo stops exposing all Prometheus Summary instruments — every duration/distribution metric is carried by its _histogram companion (which uses native exponential schema when the flag is on). The OTel pipeline therefore carries only Histograms and ExponentialHistograms — clean ingest at OTel-native backends.
If you leave prometheus.native_histograms off but still enable opentelemetry.metrics, Centrifugo's Summary metrics will be translated to OTel's legacy Summary data point shape, which most OTel-native backends treat as second-class data or drop at ingest. Use the corresponding _histogram companion metrics in your OTel dashboards in that mode, or — strongly recommended — enable native histograms and get the clean pipeline.
The pro-only Summary metrics deprecated by the same migration are: centrifugo_push_job_duration_seconds, centrifugo_clickhouse_analytics_flush_duration_seconds, centrifugo_clickhouse_analytics_batch_size, and centrifugo_shared_poll_relay_backend_duration_seconds. Each has an _histogram companion (added in v6.8.1) that becomes the canonical instrument when native histograms is enabled.
Why Summaries are being removed: in a clustered Centrifugo deployment (multiple nodes), Summary's pre-computed quantile estimates cannot be aggregated across instances — there's no mathematically valid way to combine per-node p99s into a fleet-wide p99. Histograms solve this by aggregating bucket counts across nodes, then computing percentiles with histogram_quantile(). For any multi-node deployment the Summary quantile data is, at best, misleading.
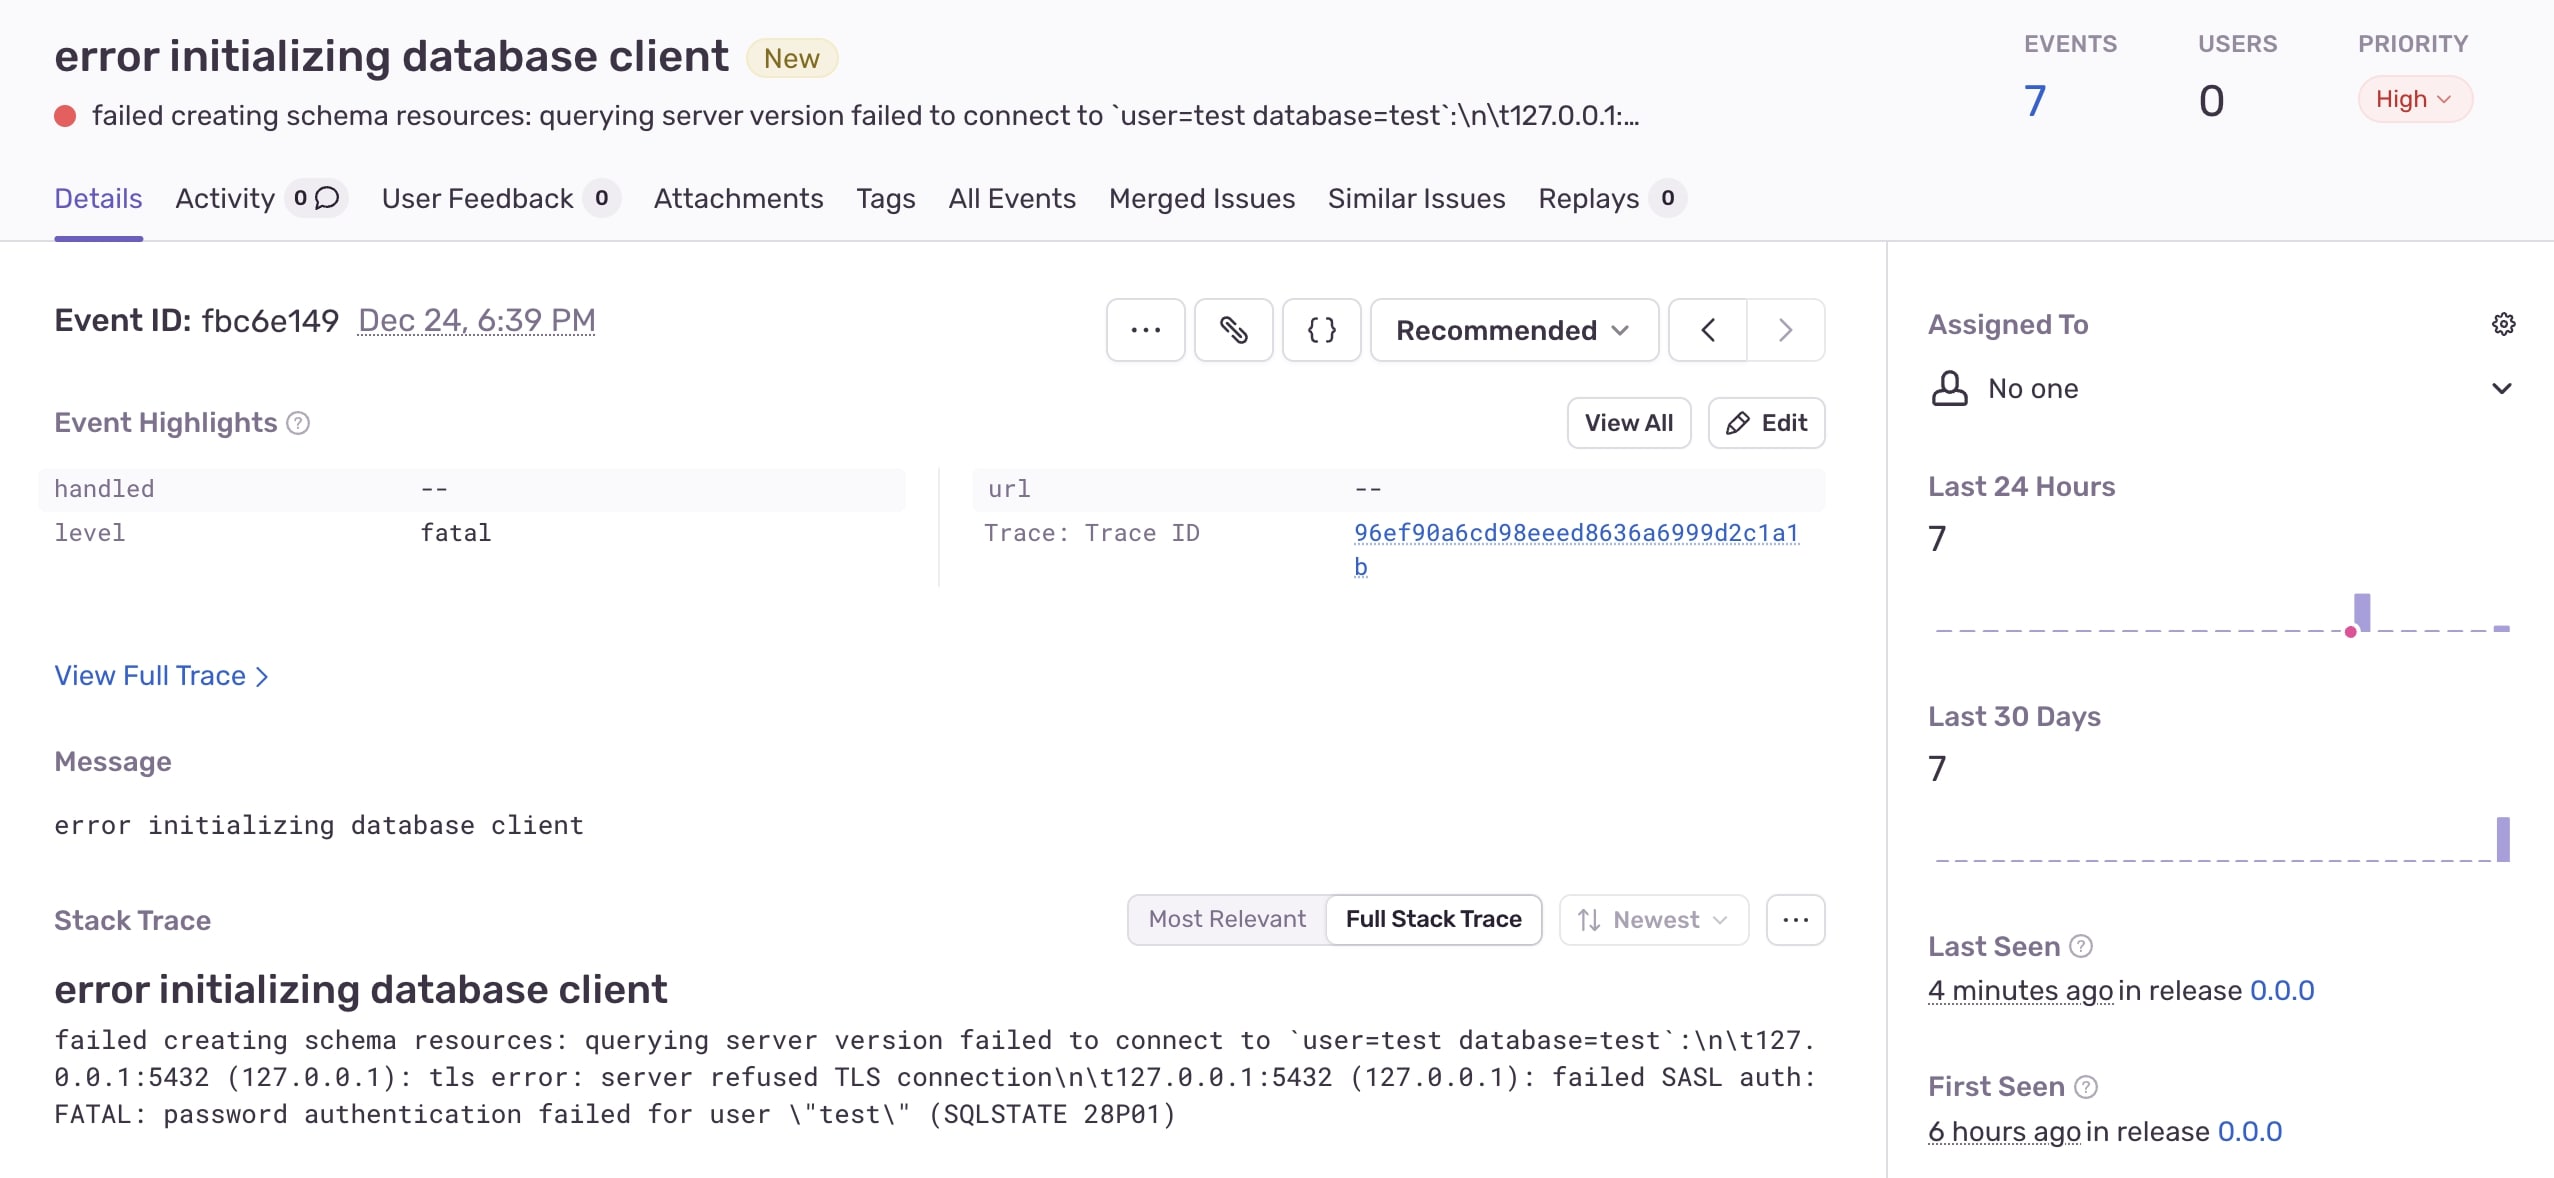
Sentry integration
Centrifugo PRO comes with an integration with Sentry. Just a couple of lines in the configuration:
{
  ...
  "sentry": {
    "enabled": true,
    "dsn": "your-project-public-dsn"
  }
}
– and you will see Centrifugo PRO errors collected by your self-hosted or cloud Sentry installation.
Sentry options
sentry.enabled
Boolean flag to enable Sentry integration.
sentry.dsn
Sentry DSN to use for error reporting.
sentry.environment
Environment name to set for Sentry events.
sentry.sample_rate
Sample rate to set for Sentry events. By default, all events are sent to Sentry. You can set a sample rate to send only a fraction of events to Sentry. For example, to send 1/10 of events set this to 0.1.