Server observability
To provide better server observability, Centrifugo supports reporting metrics in Prometheus format and can automatically export metrics to Graphite.
Metrics
Prometheus metrics
To enable Prometheus endpoint start Centrifugo with prometheus option on:
{
  "prometheus": {
    "enabled": true
  }
}
This will enable /metrics endpoint so the Centrifugo instance can be monitored by your Prometheus server.
Graphite metrics
To enable automatic export to Graphite (via TCP):
{
  "graphite": {
    "enabled": true,
    "host": "localhost",
    "port": 2003
  }
}
By default, stats will be aggregated over 10 seconds intervals inside Centrifugo and then pushed to Graphite over TCP connection.
If you need to change this aggregation interval use the graphite.interval option (a duration, default "10s").
Native histograms
New in Centrifugo v6.8.1
Centrifugo can expose Histogram metrics in Prometheus native histogram form — a sparse, exponential representation introduced in Prometheus 2.40. Native histograms auto-adapt to the value distribution and are the form that maps cleanly to OpenTelemetry's ExponentialHistogram when bridged.
To enable:
{
  "prometheus": {
    "enabled": true,
    "native_histograms": true
  }
}
The flag is opt-in. With it off, all metrics keep today's behavior (backwards compatible). New *_seconds_histogram companion metrics were added in v6.8.1 for every Summary that didn't previously have one — they are exposed unconditionally with classic buckets by default, and switch to native schema when the flag is on.
When the flag is on:
- Every Summary listed in the metrics reference below stops being exposed; its
_histogramcompanion is the canonical instrument. - Every Histogram in the package (existing and newly added companions) switches to native (sparse, exponential) schema with no explicit buckets exposed.
Operational notes:
- Breaking change for dashboards relying on
{quantile="..."}labels on the dropped Summaries — switch tohistogram_quantile()against the corresponding_histogrammetric. - Text-format Prometheus scrapes lose
_bucketseries on Histograms — only_countand_sumremain visible. Configure your scrape job to use the protobuf format to receive the native histogram data:Prometheus 2.40+ is required for native histogram ingestion.scrape_configs:
- job_name: centrifugo
scrape_protocols: [PrometheusProto, OpenMetricsText1.0.0, PrometheusText0.0.4]
# ... - Native histograms are still flagged experimental in
client_golang. The feature is opt-in for that reason.
Why enable this in plain Prometheus setups? Histograms aggregate correctly across multiple Centrifugo nodes — histogram_quantile() over fleet-wide bucket counts gives a meaningful fleet-wide p99. Summaries can't be aggregated this way (their per-node quantile estimates aren't mathematically combinable). Native histograms keep the storage cost low while providing this aggregation property. If you're scraping Centrifugo with Prometheus 2.40+, this flag gives you better percentile data for free.
If you also want to push metrics to an OpenTelemetry backend (Grafana Cloud, GCP, Datadog via OTLP, etc.) without running a Prometheus sidecar, Centrifugo PRO adds a built-in bridge that translates the in-process Prometheus registry to OTLP — see OpenTelemetry metrics export. With native histograms enabled, the bridge produces high-fidelity OTel ExponentialHistogram data points.
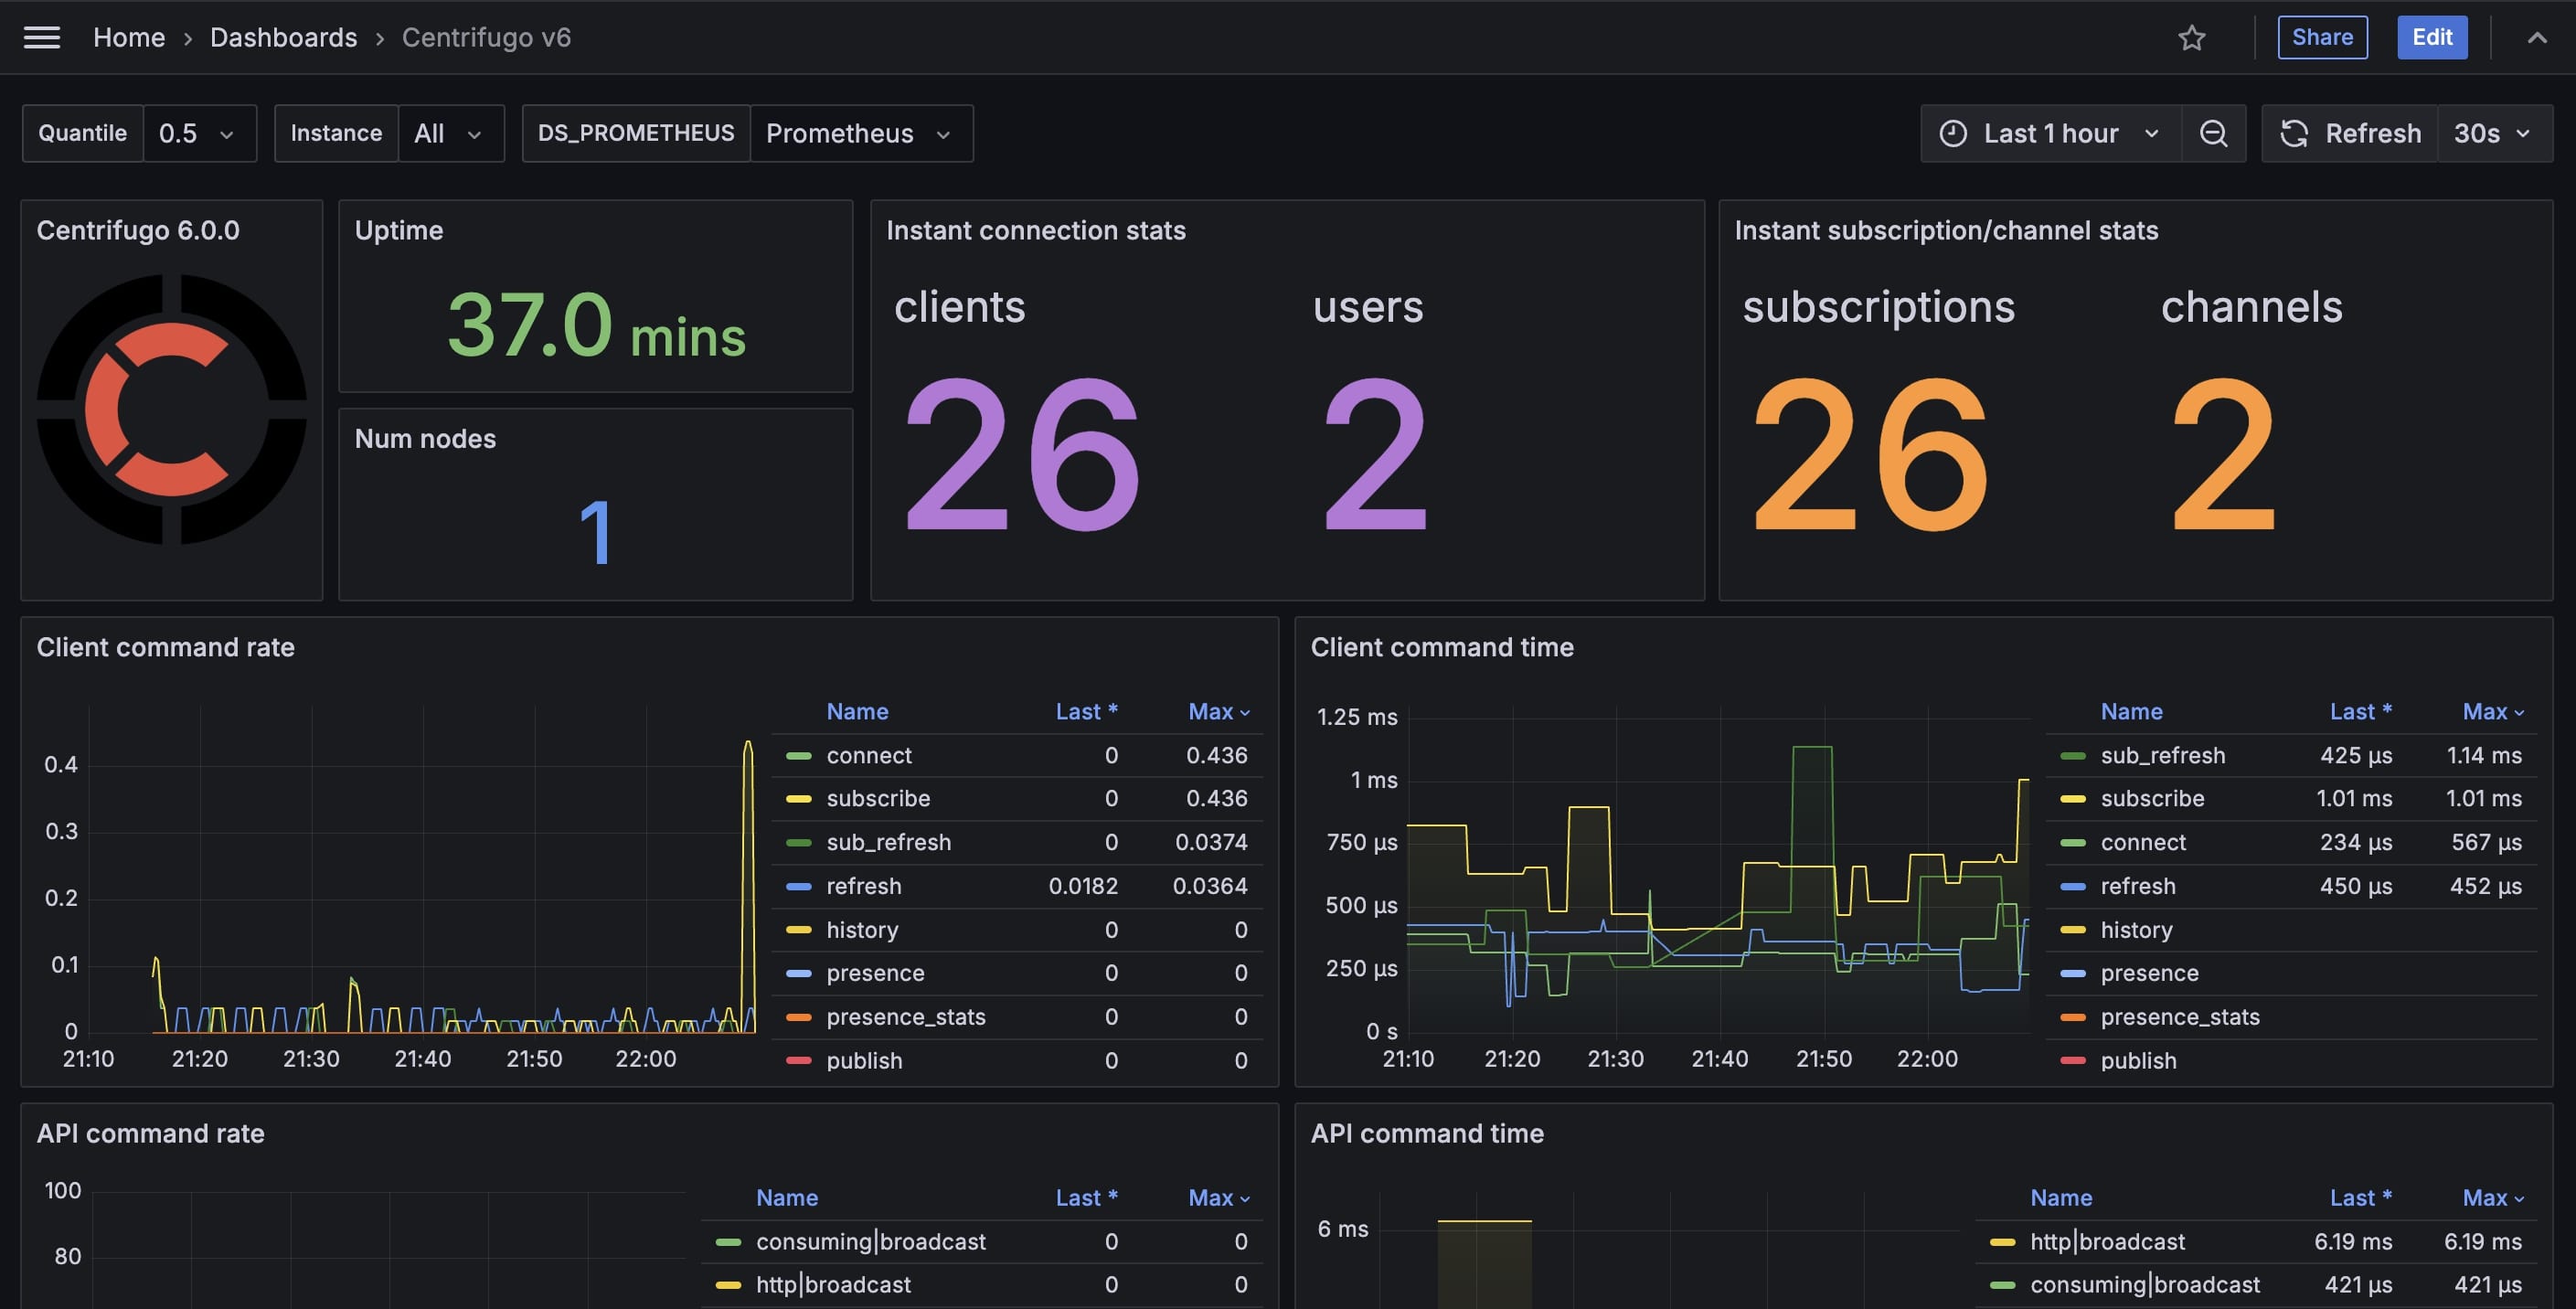
Grafana dashboard
Check out Centrifugo official Grafana dashboard for Prometheus storage. You can import that dashboard to your Grafana, point to Prometheus storage – and enjoy visualized metrics.
Exposed metrics
Here is a description of various metrics exposed by Centrifugo.
centrifugo_node_messages_sent_count
- Type: Counter
- Labels: type, channel_namespace (Centrifugo PRO)
- Description: Tracks the number of messages sent by a node to the broker.
- Usage: Use this metric to monitor the outgoing message rate and detect any anomalies or spikes in the data flow.
centrifugo_node_messages_received_count
- Type: Counter
- Labels: type, channel_namespace (Centrifugo PRO)
- Description: Measures the number of messages received from the broker.
- Usage: Helps in understanding the incoming message rate and ensures the node is receiving data as expected.
centrifugo_node_action_count
- Type: Counter
- Labels: action, channel_namespace (Centrifugo PRO)
- Description: Counts the number of various actions called within the node.
- Usage: Useful for tracking specific actions' usage and frequency.
centrifugo_node_num_clients
- Type: Gauge
- Description: Shows the current number of clients connected to the node.
- Usage: Monitor the client connections to ensure the node is not reaching its capacity.
centrifugo_node_num_users
- Type: Gauge
- Description: Displays the number of unique users connected to the node.
- Usage: Helps in understanding user engagement and capacity planning.
centrifugo_node_num_subscriptions
- Type: Gauge
- Description: Indicates the number of active subscriptions.
- Usage: Use this to monitor the subscription levels and identify any potential issues or required optimizations.
centrifugo_node_num_nodes
- Type: Gauge
- Description: Shows the total number of nodes in the cluster.
- Usage: Essential for monitoring the size of the cluster and ensuring that all nodes are operational.
centrifugo_node_build
- Type: Gauge
- Labels: version
- Description: Provides build information of the node.
- Usage: Helps in tracking the version of the application running across different environments.
centrifugo_node_num_channels
- Type: Gauge
- Description: Counts the number of channels with one or more subscribers.
- Usage: Useful for monitoring the activity and utilization of channels.
centrifugo_node_survey_duration_seconds
This Summary is deprecated and will be removed in Centrifugo v7. Use the _histogram companion below. Not exposed when prometheus.native_histograms is enabled.
- Type: Summary
- Labels: op
- Description: Captures the duration of surveys conducted by the node.
- Usage: Helps in performance monitoring and identifying any delays or issues in survey operations.
centrifugo_node_survey_duration_seconds_histogram
New in Centrifugo v6.8.1
- Type: Histogram. Uses native (sparse, exponential) schema when
prometheus.native_histogramsis enabled. - Labels: op
- Description: Same data as the Summary above, exposed in
histogram_quantile()- and OpenTelemetry-friendly form. - Usage: Prefer this metric for percentile queries and OpenTelemetry export.
centrifugo_client_num_reply_errors
- Type: Counter
- Labels: method, code, channel_namespace (Centrifugo PRO)
- Description: Counts the number of errors in replies sent to clients.
- Usage: Critical for error monitoring and ensuring smooth client interactions.
centrifugo_client_num_server_unsubscribes
- Type: Counter
- Labels: code, channel_namespace (Centrifugo PRO)
- Description: Tracks the number of server-initiated unsubscribes.
- Usage: Use this to monitor the health of client connections and identify potential issues with the server.
centrifugo_client_num_server_disconnects
- Type: Counter
- Labels: code
- Description: Tracks the number of server-initiated disconnects.
- Usage: Use this to monitor the health of client connections and identify potential issues with the server.
centrifugo_client_command_duration_seconds
This Summary is deprecated and will be removed in Centrifugo v7. Use the _histogram companion below. Not exposed when prometheus.native_histograms is enabled.
- Type: Summary
- Labels: method, channel_namespace (Centrifugo PRO)
- Description: Measures the duration of commands executed by clients.
- Usage: Essential for performance monitoring and ensuring timely responses to client commands.
centrifugo_client_command_duration_seconds_histogram
New in Centrifugo v6.8.1
- Type: Histogram. Uses native (sparse, exponential) schema when
prometheus.native_histogramsis enabled. - Labels: method, channel_namespace (Centrifugo PRO)
- Description: Same data as the Summary above, exposed in
histogram_quantile()- and OpenTelemetry-friendly form. - Usage: Prefer this metric for percentile queries and OpenTelemetry export.
centrifugo_client_recover
- Type: Counter
- Labels: recovered, channel_namespace (Centrifugo PRO), has_recovered_publications
- Description: Counts the number of recover operations performed.
- Usage: Helps in tracking the system's resilience and recovery mechanisms. Label
recovered- was recovery successful or not. Labelhas_recovered_publications- did successful recovery contain some publications or no publications were missed by a client.
centrifugo_client_recovered_publications
New in Centrifugo v6.2.4
Note, this metric is disabled by default. To enable it set prometheus.recovered_publications_histogram option to true in the configuration file.
{
  "prometheus": {
    "recovered_publications_histogram": true
  }
}
- Type: Histogram
- Labels: channel_namespace
- Description: Measures the number of publications recovered by clients.
- Usage: Use this metric to monitor the effectiveness of the recovery process.
centrifugo_node_client_connection_limit
- Type: Counter
- Labels: None
- Description: Number of refused requests due to the node client connection limit.
- Usage: Useful for monitoring the load on the Centrifugo node and identifying when clients are being refused connections due to reaching the connection limit.
centrifugo_client_connections_accepted
- Type: Counter
- Labels: transport, accept_protocol (Centrifugo PRO), client_name, client_version
- Description: Count of accepted client connections by transport type, protocol, client name, and version.
- Usage: Helps in tracking connection patterns, understanding which clients and transports are being used, and monitoring client version distribution across your infrastructure.
centrifugo_client_connections_inflight
- Type: Gauge
- Labels: transport, accept_protocol (Centrifugo PRO), client_name, client_version
- Description: Number of currently active client connections by transport type, protocol, client name, and version.
- Usage: Useful for real-time monitoring of active connections, understanding the current load distribution across different transports and client types, and capacity planning.
centrifugo_client_subscriptions_accepted
- Type: Counter
- Labels: client_name, channel_namespace (Centrifugo PRO)
- Description: Count of accepted client subscriptions by client name and channel namespace.
- Usage: Useful for monitoring subscription patterns, understanding which clients are subscribing to which channel namespaces, and tracking subscription volume over time.
centrifugo_client_subscriptions_inflight
- Type: Gauge
- Labels: client_name, channel_namespace (Centrifugo PRO)
- Description: Number of currently active client subscriptions by client name and channel namespace.
- Usage: Essential for real-time monitoring of active subscriptions, understanding which clients and channel namespaces have the most active subscriptions, and capacity planning for subscription load.
centrifugo_client_ping_pong_duration_seconds
- Type: Histogram
- Labels: transport
- Description: Tracks the duration of ping/pong – i.e. time between sending ping to client and receiving pong from client.
- Usage: Helps in monitoring the client protocol performance, latency, making sure frame processing does not take too much time on the client side.
centrifugo_transport_messages_sent
- Type: Counter
- Labels: transport, frame_type, channel_namespace
- Description: Tracks the number of messages sent to client connections over specific transports.
- Usage: Essential for understanding the data flow and performance of different transports.
centrifugo_transport_messages_sent_size
- Type: Counter
- Labels: transport, frame_type, channel_namespace
- Description: Measures the size of messages (in bytes) sent to client connections over specific transports.
- Usage: Helps in monitoring the network bandwidth usage and optimizing the data transfer.
centrifugo_transport_messages_received
- Type: Counter
- Labels: transport, frame_type, channel_namespace
- Description: Counts the number of messages received from client connections over specific transports.
- Usage: Important for ensuring that messages are being successfully received and processed.
centrifugo_transport_messages_received_size
- Type: Counter
- Labels: transport, frame_type, channel_namespace
- Description: Measures the size of messages (in bytes) received from client connections over specific transports.
- Usage: Use this metric to monitor the incoming data size and optimize the application's performance.
centrifugo_transport_outgoing_close_count
Available since v6.8.4
- Type: Counter
- Labels: transport, code
- Description: Counts the number of close frames sent to client connections, by transport and close code. Only server-sent (outgoing) close codes are recorded – client-supplied close codes are not counted to keep the
codelabel cardinality bounded. - Usage: Helps in monitoring why and how often the server closes client connections over specific transports.
Exposed for WebSocket and unidirectional WebSocket.
centrifugo_proxy_duration_seconds
This Summary is deprecated and will be removed in Centrifugo v7. Use centrifugo_proxy_duration_seconds_histogram (below). Not exposed when prometheus.native_histograms is enabled.
- Type: Summary
- Labels: protocol, type, name
- Description: Captures the duration of proxy calls.
- Usage: Critical for understanding the performance of proxy calls and identifying any potential bottlenecks or issues.
centrifugo_proxy_duration_seconds_histogram
- Type: Histogram. Uses native (sparse, exponential) schema when
prometheus.native_histogramsis enabled. - Labels: protocol, type, name
- Description: Same data as the Summary above, exposed in
histogram_quantile()- and OpenTelemetry-friendly form. - Usage: Prefer this metric for percentile queries and OpenTelemetry export.
centrifugo_proxy_errors
- Type: Counter
- Labels: protocol, type, name
- Description: Counts the number of errors occurred during proxy calls.
- Usage: Helps in monitoring the reliability of proxy services and ensuring error-free operations.
Per-proxy ("granular") timings and errors are not separate metrics — they are exposed via the name label on the centrifugo_proxy_* metrics above, where name is the configured proxy name.
centrifugo_api_command_duration_seconds
This Summary is deprecated and will be removed in Centrifugo v7. Use centrifugo_api_command_duration_seconds_histogram (below). Not exposed when prometheus.native_histograms is enabled.
- Type: Summary
- Labels: protocol, method
- Description: Tracks the duration of API commands.
- Usage: Helps in monitoring the API performance and ensuring timely responses.
centrifugo_api_command_duration_seconds_histogram
- Type: Histogram. Uses native (sparse, exponential) schema when
prometheus.native_histogramsis enabled. - Labels: protocol, method
- Description: Same data as the Summary above, exposed in
histogram_quantile()- and OpenTelemetry-friendly form. - Usage: Prefer this metric for percentile queries and OpenTelemetry export.
centrifugo_api_rpc_duration_seconds
This Summary is deprecated and will be removed in Centrifugo v7. Use centrifugo_api_rpc_duration_seconds_histogram (below). Not exposed when prometheus.native_histograms is enabled.
- Type: Summary
- Labels: protocol, method
- Description: Tracks the duration of API RPC calls.
- Usage: Helps in monitoring RPC performance and ensuring timely responses.
centrifugo_api_rpc_duration_seconds_histogram
New in Centrifugo v6.8.1
- Type: Histogram. Uses native (sparse, exponential) schema when
prometheus.native_histogramsis enabled. - Labels: protocol, method
- Description: Same data as the Summary above, exposed in
histogram_quantile()- and OpenTelemetry-friendly form. - Usage: Prefer this metric for percentile queries and OpenTelemetry export.
centrifugo_node_pub_sub_lag_seconds
- Type: Histogram
- Labels:
- Description: Tracks pub sub lag in seconds.
- Usage: Helps in monitoring of PUB/SUB layer performance. Note, this metric may be not exact in distributed environment due to time skew (to minify effect use NTP). In this case it still may be useful to identifies growth in lag.
centrifugo_node_broadcast_duration_seconds
- Type: Histogram
- Labels: type, channel_namespace (Centrifugo PRO)
- Description: Tracks broadcast duration in seconds.
- Usage: Useful to monitor time required for broadcasting the message to subscribers on the node. If it grows and the number of messages increases – may indicate the need to scale.
centrifugo_node_tags_filter_dropped_publications
- Type: Counter
- Labels: channel_namespace (Centrifugo PRO)
- Description: Counts the number of publications dropped due to tags filtering.
- Usage: Helps in monitoring the effectiveness of tags filtering and identifying any potential issues.
centrifugo_broker_redis_pub_sub_errors
- Type: Counter
- Labels: broker_name, error
- Description: Number of times there was an error in Redis PUB/SUB connection.
- Usage: Critical for monitoring Redis broker health and identifying connection issues that could affect message delivery.
centrifugo_broker_redis_pub_sub_dropped_messages
- Type: Counter
- Labels: broker_name, channel_type
- Description: Number of dropped messages on application level in Redis PUB/SUB.
- Usage: Helps identify message loss issues in the Redis broker, which could indicate performance problems or buffer overflows.
centrifugo_broker_redis_pub_sub_buffered_messages
- Type: Gauge
- Labels: broker_name, channel_type, pub_sub_processor
- Description: Number of messages buffered in Redis PUB/SUB.
- Usage: Monitor buffer levels to detect potential bottlenecks in message processing and prevent message drops.
centrifugo_map_broker_redis_pub_sub_errors
- Type: Counter
- Labels: broker_name, error
- Description: Number of times there was an error in Redis PUB/SUB connection of the Redis map broker (Centrifugo PRO).
- Usage: Critical for monitoring Redis map broker health and identifying connection issues that could affect message delivery.
centrifugo_map_broker_redis_pub_sub_dropped_messages
- Type: Counter
- Labels: broker_name, channel_type
- Description: Number of dropped messages on application level in Redis PUB/SUB of the Redis map broker (Centrifugo PRO).
- Usage: Helps identify message loss issues in the Redis map broker, which could indicate performance problems or buffer overflows.
centrifugo_map_broker_redis_pub_sub_buffered_messages
- Type: Gauge
- Labels: broker_name, channel_type, pub_sub_processor
- Description: Number of messages buffered in Redis PUB/SUB of the Redis map broker (Centrifugo PRO).
- Usage: Monitor buffer levels to detect potential bottlenecks in map broker message processing and prevent message drops.
centrifugo_broker_publish_suppressed_count
- Type: Counter
- Labels: reason, channel_namespace (Centrifugo PRO)
- Description: Number of suppressed publish operations (e.g. deduplicated by idempotency key or skipped due to a version conflict).
- Usage: Monitor how often publishes are suppressed and why, to validate idempotency/versioning behavior.
centrifugo_map_broker_publish_suppressed_count
- Type: Counter
- Labels: reason, channel_namespace (Centrifugo PRO)
- Description: Number of suppressed map publish operations (Centrifugo PRO).
- Usage: Monitor how often map publishes are suppressed and why.
centrifugo_map_broker_remove_suppressed_count
- Type: Counter
- Labels: reason, channel_namespace (Centrifugo PRO)
- Description: Number of suppressed map remove operations (Centrifugo PRO).
- Usage: Monitor how often map removes are suppressed and why.
centrifugo_map_broker_cleanup_lag_seconds
- Type: Gauge
- Labels: broker_name
- Description: Lag between now and the oldest expired entry awaiting cleanup in the map broker (Centrifugo PRO). 0 means caught up.
- Usage: Detect when the map broker cleanup worker falls behind on pruning expired state.
centrifugo_map_broker_cleanup_removed_count
- Type: Counter
- Labels: broker_name
- Description: Total number of expired entries removed by map broker cleanup (Centrifugo PRO).
- Usage: Observe how much expired state the map broker is pruning over time.
centrifugo_map_broker_cleanup_errors_count
- Type: Counter
- Labels: broker_name
- Description: Total number of map broker cleanup errors (Centrifugo PRO).
- Usage: Alert on cleanup failures that could let expired state accumulate.
centrifugo_broker_postgres_cleanup_removed_total
- Type: Counter
- Labels: broker_name, pass
- Description: Total rows removed by each PostgreSQL stream broker cleanup pass (Centrifugo PRO). The
passlabel identifies the table being cleaned. - Usage: Observe how much expired data the PostgreSQL broker is pruning per cleanup pass.
centrifugo_broker_postgres_outbox_cursor_lag_seconds
- Type: Gauge
- Labels: broker_name, shard
- Description: Time between the PostgreSQL stream broker outbox cursor's row created_at and now, per shard (Centrifugo PRO).
- Usage: Detect when outbox consumption falls behind, which delays publication delivery.
centrifugo_map_broker_postgres_outbox_cursor_lag_seconds
- Type: Gauge
- Labels: broker_name, shard
- Description: Time between the PostgreSQL map broker outbox cursor's row created_at and now, per shard (Centrifugo PRO).
- Usage: Detect when map broker outbox consumption falls behind.
centrifugo_broker_postgres_partitions
- Type: Gauge
- Labels: broker_name
- Description: Count of PostgreSQL stream broker stream/history table partitions (Centrifugo PRO).
- Usage: Monitor partition growth of the PostgreSQL broker tables.
centrifugo_map_broker_postgres_partitions
- Type: Gauge
- Labels: broker_name
- Description: Count of PostgreSQL map broker table partitions (Centrifugo PRO).
- Usage: Monitor partition growth of the PostgreSQL map broker tables.
centrifugo_broker_redis_node_grouped_topology_rebuild_count
- Type: Counter
- Labels: broker_name, trigger, result
- Description: Number of node-grouped sharded Pub/Sub subscription rebuilds after a Redis Cluster topology change (Centrifugo PRO). The
triggerlabel ispoll(a periodic check saw the change) orsunsubscribe(Redis pushed a slot-migration notice);resultissuccessorerror. - Usage: Alert on
result="error"— node-grouped subscriptions did not re-establish, so delivery stays degraded until the next change is noticed.
centrifugo_broker_redis_node_grouped_topology_error_count
- Type: Counter
- Labels: broker_name, op, stage
- Description: Number of errors while reading or applying Redis Cluster topology for node-grouped sharded Pub/Sub (Centrifugo PRO). The
oplabel isdetect(the periodic check, usually self-heals next cycle) orrebuild(re-establishing subscriptions);stageiscluster_slots,node_mapping, orpartition_mapping. - Usage: Use the labels to see which Redis step fails.
op="rebuild"errors are more serious thanop="detect".
centrifugo_broker_redis_node_grouped_unknown_slot_owner_count
- Type: Counter
- Labels: broker_name
- Description: Number of times node-grouped sharded Pub/Sub saw a hash slot owned by a Redis node not yet known to the client, which fires a discovery probe (Centrifugo PRO). Happens right after a node joins or reshards.
- Usage: A short spike after a topology change is normal. A value that keeps growing means the client never discovered the new node and some channels on it may go undelivered.
centrifugo_broker_redis_node_grouped_topology_change_gap_seconds
- Type: Histogram
- Labels: broker_name
- Description: Time node-grouped sharded Pub/Sub subscriptions were torn down during a Redis Cluster topology change, from teardown to fully re-subscribed (Centrifugo PRO).
- Usage: This is the real delivery interruption a cluster scale or reshard causes. Watch p99 to size the impact.
The Redis map broker exposes the same four metrics under the map_broker subsystem (Centrifugo PRO): centrifugo_map_broker_redis_node_grouped_topology_rebuild_count, centrifugo_map_broker_redis_node_grouped_topology_error_count, centrifugo_map_broker_redis_node_grouped_unknown_slot_owner_count, and centrifugo_map_broker_redis_node_grouped_topology_change_gap_seconds, with the same labels and meaning for the map broker.
Traces
OpenTelemetry
At this point Centrifugo can export traces for HTTP and GRPC server API requests in OpenTelemetry format.
To enable:
{
  "opentelemetry": {
    "enabled": true,
    "api": true
  }
}
OpenTelemetry must be explicitly turned on to avoid tracing overhead when it's not needed.
To configure OpenTelemetry export behaviour we are relying on OpenTelemetry environment vars supporting only HTTP export endpoints for now.
So a simple example to run Centrifugo with server API tracing would be running Jaeger with COLLECTOR_OTLP_ENABLED:
docker run --rm -it --name jaeger \
  -e COLLECTOR_OTLP_ENABLED=true \
  -p 16686:16686 \
  -p 4318:4318 \
  jaegertracing/all-in-one:latest
Then start Centrifugo:
OTEL_EXPORTER_OTLP_ENDPOINT="http://localhost:4318" CENTRIFUGO_OPENTELEMETRY=1 CENTRIFUGO_OPENTELEMETRY_API=1 ./centrifugo
Send some API requests - and open http://localhost:16686 to see traces in Jaeger UI.
By default, Centrifugo exports traces in http/protobuf format. If you want to use GRPC exporter then it's possible to turn it on by setting environment variable OTEL_EXPORTER_OTLP_PROTOCOL to grpc (GRPC exporter format supported since Centrifugo v5.0.3).
Export to Google Cloud (ADC)
New in Centrifugo v6.8.2
Google Cloud's OTLP endpoint (telemetry.googleapis.com) requires every request to carry a valid OAuth2 access token. The standard OTLP exporter does not attach one, so by default export to Google Cloud fails as unauthenticated — the usual workaround is to run a sidecar collector just to inject credentials.
Set opentelemetry.google_cloud_adc_auth to true to make Centrifugo authenticate the exporter with Google Cloud Application Default Credentials (ADC), so you can push directly to telemetry.googleapis.com without a sidecar:
{
  "opentelemetry": {
    "enabled": true,
    "api": true,
    "google_cloud_adc_auth": true
  }
}
The option works with both exporter protocols — over grpc the ADC token is attached as a per-RPC credential, over http/protobuf via an OAuth2 HTTP client transport. In both cases the token is minted lazily on first export and then cached and refreshed automatically. The endpoint and target project are still configured via the standard OTEL_EXPORTER_OTLP_* environment variables:
OTEL_EXPORTER_OTLP_ENDPOINT="https://telemetry.googleapis.com" \
OTEL_EXPORTER_OTLP_PROTOCOL="grpc" \
OTEL_RESOURCE_ATTRIBUTES="gcp.project_id=YOUR_PROJECT_ID" \
CENTRIFUGO_OPENTELEMETRY=1 CENTRIFUGO_OPENTELEMETRY_API=1 CENTRIFUGO_OPENTELEMETRY_GOOGLE_CLOUD_ADC_AUTH=1 ./centrifugo
Set the target project via OTEL_RESOURCE_ATTRIBUTES="gcp.project_id=...". Do not put it in OTEL_EXPORTER_OTLP_HEADERS as x-goog-user-project — Google warns that this can produce duplicate values and fail requests.
Exported telemetry carries standard OTel resource attributes: service.name is centrifugo (override with OTEL_SERVICE_NAME), attributes from OTEL_RESOURCE_ATTRIBUTES are merged in (environment values take precedence over Centrifugo defaults), and since Centrifugo v6.8.3 service.instance.id defaults to the unique Centrifugo node ID.
ADC must be resolvable in the runtime environment — automatic on GKE/GCE/Cloud Run via the attached service account, or locally via GOOGLE_APPLICATION_CREDENTIALS / gcloud auth application-default login. When ADC resolves through the metadata server (no explicit credentials file), Centrifugo performs a one-time metadata lookup at startup; the credential is opt-in via the flag, so there is no probe unless you enable it.
In Centrifugo PRO the same flag also authenticates OpenTelemetry metrics export to telemetry.googleapis.com.
Logs
Logging may be configured using log_level option. It may have the following values:
nonetracedebuginfo(default)warnerror
We generally do not recommend anything below info to be used in production.
By default, Centrifugo logs to STDOUT. Usually this is what you need when running servers on modern infrastructures. Logging into file may be configured using log_file option.