Appendix #3: Adding Prometheus and Grafana
Let's move a bit further and show how to add Centrifugo monitoring to our messenger application. We will use Prometheus and Grafana for this.
Prometheus
Prometheus is a popular monitoring system and time series database. It collects metrics from monitored targets by scraping metrics HTTP endpoints. Centrifugo has built-in support for Prometheus metrics.
The first step would be adding Prometheus service to our docker-compose.yml file. We will use the official Prometheus Docker image. Here is how the service definition looks like:
  prometheus:
    image: prom/prometheus:v3.12.0
    depends_on:
      - centrifugo
    volumes:
      - ./prometheus/prometheus.yml:/etc/prometheus/prometheus.yml:ro
    command:
      - '--config.file=/etc/prometheus/prometheus.yml'
    ports:
      - "9090:9090"
We also need to create a prometheus.yml file in the prometheus directory of our project. Here is how it looks like:
global:
  scrape_interval: 5s

scrape_configs:
  - job_name: 'centrifugo'
    static_configs:
      - targets: ['centrifugo:8000']
This configuration tells Prometheus to scrape metrics from Centrifugo container every 5 seconds.
In Centrifugo configuration we also need to enable Prometheus metrics endpoint. Here is how it looks like:
{
    ...
    "prometheus": {
        "enabled": true,
        "instrument_http_handlers": true,
        "channel_namespace_resolution": true
    }
}
Besides enabling the metrics endpoint, we turn on two extra options. instrument_http_handlers adds metrics for Centrifugo's HTTP API handlers. channel_namespace_resolution asks Centrifugo to label channel metrics with the channel namespace, so activity can be broken down per namespace (e.g. our personal namespace) – note this one is a Centrifugo PRO feature: on Centrifugo OSS the option is accepted but the channel_namespace label stays empty. We keep it in the config so the namespace breakdowns light up immediately if you run this tutorial against PRO.
Now once you start the app with docker compose up you can open Prometheus UI at http://localhost:9090 and see Centrifugo metrics.
If you have not used Prometheus before, two pages are worth knowing. http://localhost:9090/targets lists what Prometheus is scraping – the centrifugo target should be UP, and if it is not, nothing else will work. On http://localhost:9090/query you can type a metric name, say centrifugo_node_num_clients, and see its value. Every metric Centrifugo exposes is listed in the metrics reference.
Grafana
Many users prefer to use Grafana for visualizing metrics collected by Prometheus. Let's add Grafana service to our docker-compose.yml file. We will use the official Grafana Docker image. Here is how the service definition looks like:
  grafana:
    image: grafana/grafana-oss:12.4.3
    depends_on:
      - prometheus
    # Expose Grafana on host port 3000
    ports:
      - "3000:3000"
    environment:
      - GF_SECURITY_ADMIN_USER=admin
      - GF_SECURITY_ADMIN_PASSWORD=admin
    volumes:
      # Mount local provisioning directory to automatically configure Prometheus as a
      # datasource and to load the official Centrifugo dashboard
      - ./grafana/provisioning:/etc/grafana/provisioning
      - ./grafana/dashboards:/var/lib/grafana/dashboards
      - grafana-data:/var/lib/grafana
Two small provisioning files go with it, so that Grafana comes up already configured – no clicking through the UI. The first one points Grafana at Prometheus:
apiVersion: 1

datasources:
  - name: Prometheus
    type: prometheus
    url: http://prometheus:9090
    access: proxy
    isDefault: true
This configuration tells Grafana to use Prometheus as a default datasource.
The second one tells Grafana to load dashboards from a directory on disk, so we don't have to import anything by hand:
apiVersion: 1

providers:
  - name: Centrifugo
    orgId: 1
    folder: ''
    type: file
    disableDeletion: false
    updateIntervalSeconds: 10
    allowUiUpdates: true
    options:
      path: /var/lib/grafana/dashboards
      foldersFromFilesStructure: false
The directory it points at is the one we mounted above. Put the JSON of Centrifugo official Grafana dashboard there as grafana/dashboards/centrifugo.json – it's already committed in the tutorial repository, so there is nothing to download.
Now once you start the app with docker compose up you can open Grafana UI at http://localhost:3000, login with admin/admin credentials, and the Centrifugo dashboard is already there:
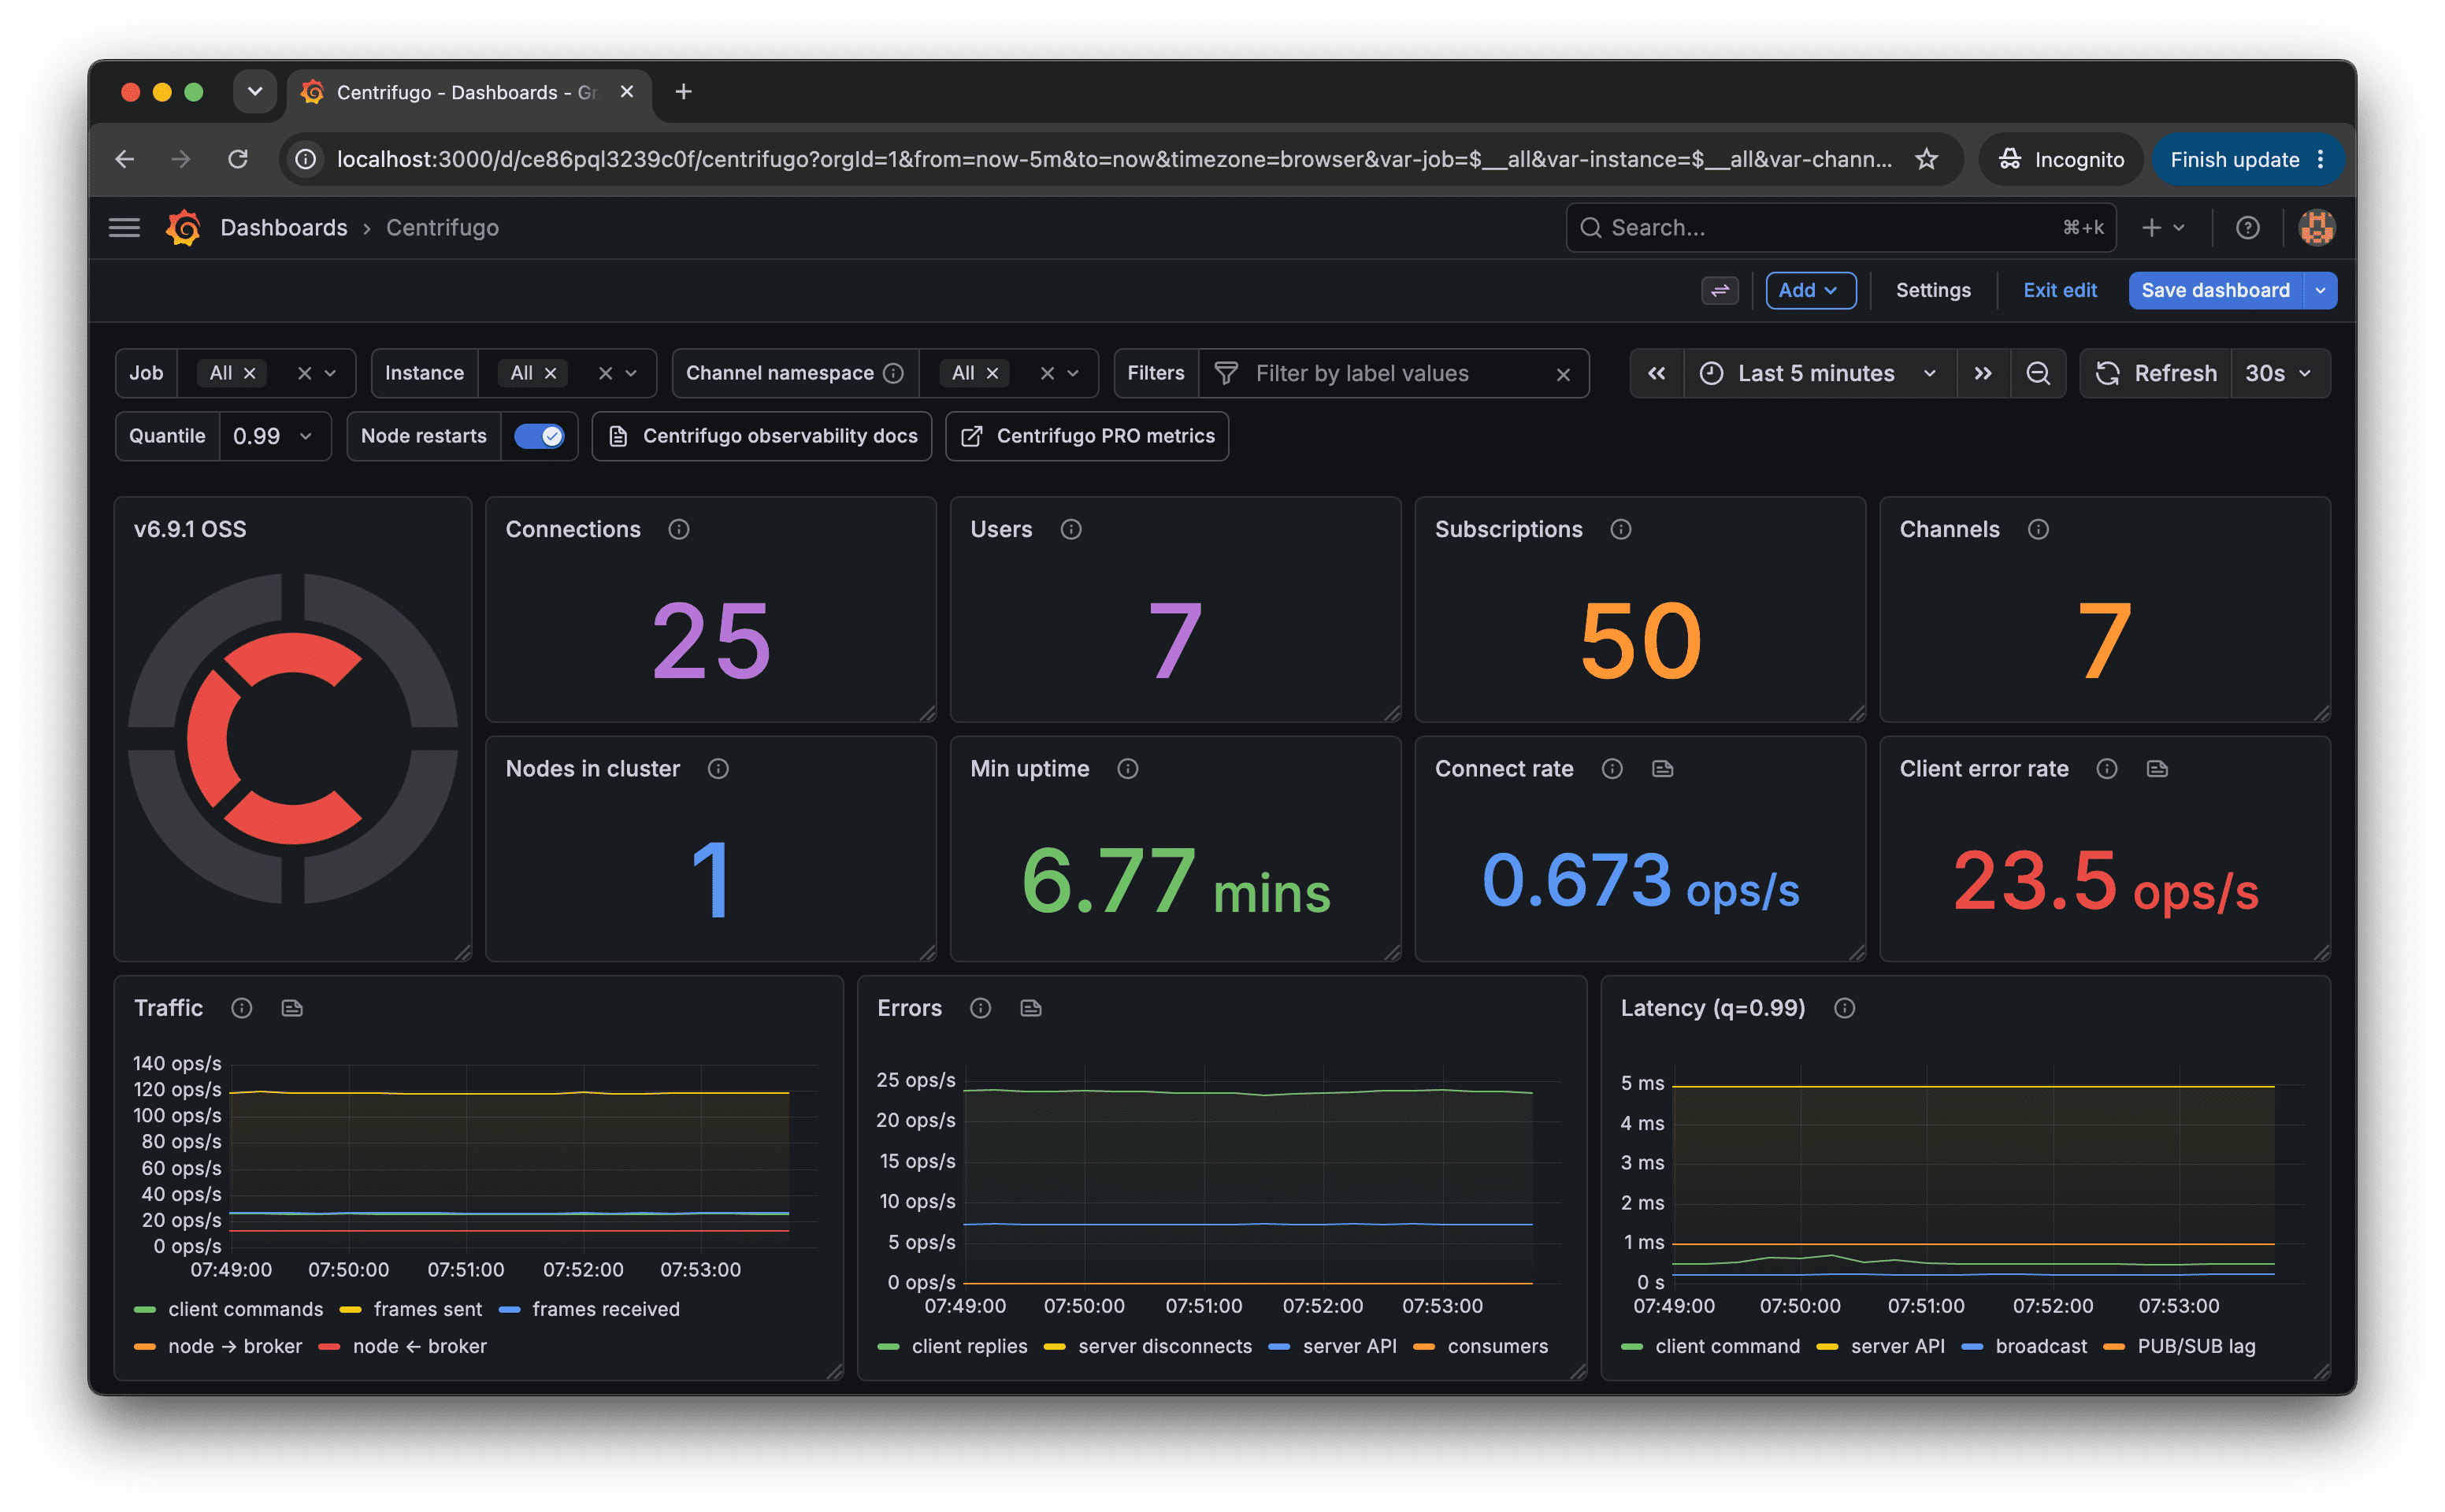
That's it! Now you have Centrifugo metrics visualized in the application. You can even use Grafana alerting feature to notify you over tons of supported communication channels (Slack, email, and so on) in case of metric changes.
That is expected on a freshly started stack – metrics only appear once something happens. Open the app at http://localhost:9000, log in as alice and send a few messages the way we did in the earlier chapters, then come back to Grafana. Connections, commands and delivery panels fill up within a few seconds. It also helps to set the dashboard time range (top right) to something short like Last 15 minutes while you experiment.
Most of the dashboard's rows are collapsed by default — expand the ones you need. The first four rows cover what this tutorial actually exercises: connections, client commands, latency and real-time delivery. Rows prefixed with PRO · cover Centrifugo PRO metrics and stay empty here, as do rows for features this setup does not use — there is no proxy configured, and the tutorial runs the memory engine rather than Redis, so the Proxy and broker rows have nothing to show.
Importing the dashboard instead of provisioning it
Provisioning from disk suits a Docker Compose stack, where the dashboard travels with the repository and is there on the first docker compose up. It is not the only way, and often not the right one: if you are adding Centrifugo to a Grafana you don't own the filesystem of – a managed instance, or one someone else operates – import the dashboard from the Grafana dashboard registry instead.
In the Grafana UI go to Dashboards, press New → Import, put the dashboard ID 13039 into the form and press Load. Then select your Prometheus as a datasource and press Import. The same dashboard, without any file mounts or provisioning config.
The two approaches do the same thing by different means, so pick one. If you import while the provisioning above is also active you simply end up with two copies of the dashboard – harmless, but confusing.
One difference worth knowing: a provisioned dashboard is read-only in the UI unless the provider sets allowUiUpdates: true, which the config above does – so in this tutorial you can edit it. Even then, edits live only in Grafana's database and the file on disk stays the source of truth, so re-provisioning can overwrite them. If you plan to adapt the dashboard heavily, either edit grafana/dashboards/centrifugo.json in the repository, or import it and keep your copy in Grafana.
We did it again
Here we showed how to add Prometheus and Grafana to our messenger application to monitor Centrifugo metrics.
In real-world applications the way of Prometheus and Grafana setup can be different, but the core idea is the same. For example, in Kubernetes you can use Helm charts to deploy Prometheus and Grafana stack and use k8s service discovery to find Centrifugo instances.
For the convenience we've included Prometheus and Grafana support to the source code of our tutorial, together with the provisioned Centrifugo dashboard – so it all works out of the box.